
The Complete Guide to Android Studio Profiler: Mastering Performance Analysis


Table of Contents
Introduction
Getting Started with Android Profiler
CPU Profiler
Memory Profiler
Network Profiler
Power/Energy Profiler
Advanced Features
Best Practices
Introduction
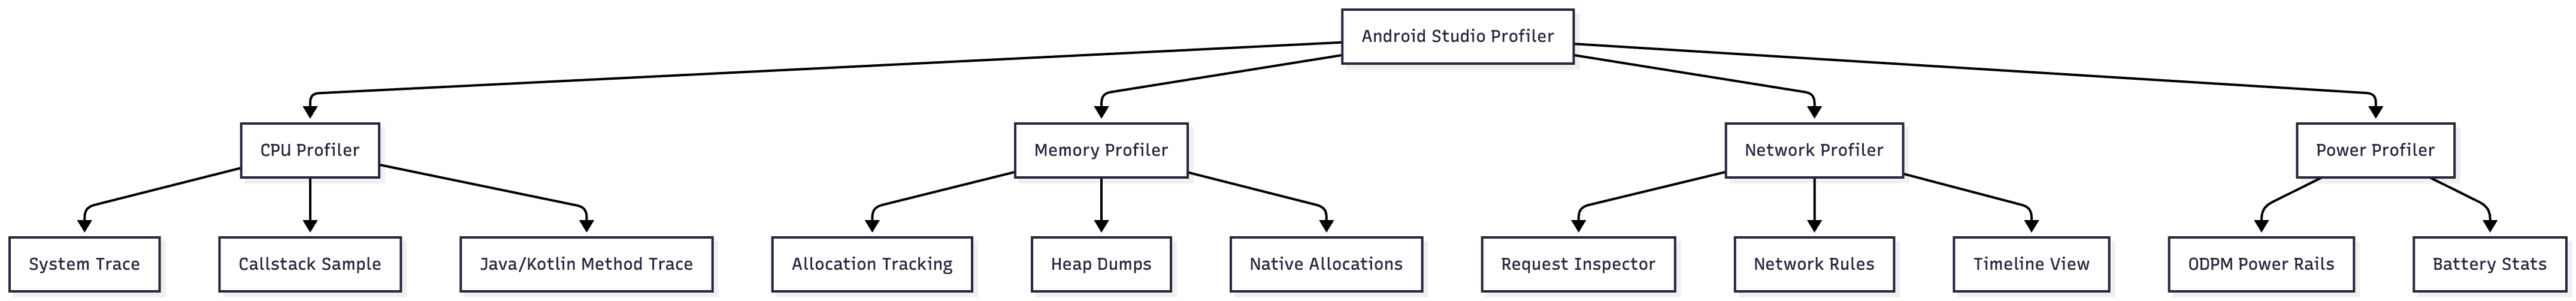
The Android Studio Profiler is a comprehensive suite of performance analysis tools that replaced the older Android Monitor in Android Studio 3.0. It provides real-time insights into your app’s CPU, memory, network, and energy consumption, enabling developers to diagnose and optimize performance issues systematically.
Why Profiling Matters
Performance directly impacts user experience. A slow app leads to poor ratings, decreased engagement, and ultimately, user abandonment. The Android Profiler helps you identify and fix:
Janky animations (dropped frames)
Memory leaks (gradual memory accumulation)
Excessive network usage (battery drain and slow data transfer)
CPU bottlenecks (unresponsive UI)
Energy consumption issues (rapid battery drain)
Profiler Architecture
Getting Started with Android Profiler
Opening the Profiler
There are multiple ways to access the Profiler:
Menu Bar: Navigate to View > Tool Windows > Profiler
Toolbar: Click the Profile button
Bottom Toolbar: Select the Profiler tab
Requirements for Optimal Profiling
To get the most out of the Profiler, ensure you have:
A profileable or debuggable app
Virtual or physical device running API level 29 or higher with Google Play
Android Gradle Plugin 7.3 or higher
Profileable vs Debuggable Apps
This is a critical decision that affects measurement accuracy:
Profileable Apps (Recommended)
Configuration in AndroidManifest.xml:
<application>
    <profileable android:shell=”true” />
</application>
Advantages:
Based on release build variant
~28% better performance than debug builds
Timing-accurate profiling without debug overhead
Available on Android 10 (API 29) and higher
Limitations:
Cannot record Java/Kotlin allocations
Cannot capture heap dumps
No interaction timeline
Debuggable Apps
Use When:
You need allocation tracking
You need heap dumps for memory leak analysis
You want to see the interaction timeline with user inputs
Trade-off:
Significant performance overhead (compiler optimizations disabled)
Not suitable for accurate performance measurements
Profiler Interface Overview

Navigation Shortcuts:
WASD keys: Navigate and zoom through traces
Mouse selection: Select time ranges to filter data
Press ?: Show all navigation controls
CPU Profiler
The CPU Profiler measures CPU usage in real-time and monitors thread activity, helping identify performance bottlenecks.
Recording Methods Comparison

1. System Trace Recording
Purpose: System-wide performance analysis showing how your app interacts with CPU cores and system resources.
When to Use:
Investigating UI jank and frame drops
Understanding thread scheduling
Analyzing system call overhead
Debugging rendering pipeline issues
Example Workflow:
// Triggering custom trace sections in code
class MainActivity : AppCompatActivity() {
    override fun onCreate(savedInstanceState: Bundle?) {
        super.onCreate(savedInstanceState)

        // Add custom trace sections
        Trace.beginSection(”LoadUserData”)
        loadUserData()
        Trace.endSection()

        Trace.beginSection(”InitializeUI”)
        setContentView(R.layout.activity_main)
        initializeViews()
        Trace.endSection()
    }

    private fun loadUserData() {
        // Heavy data loading operation
        Thread.sleep(100) // Simulated delay
    }

    private fun initializeViews() {
        // UI initialization
    }
}
Timeline Sections Explained:
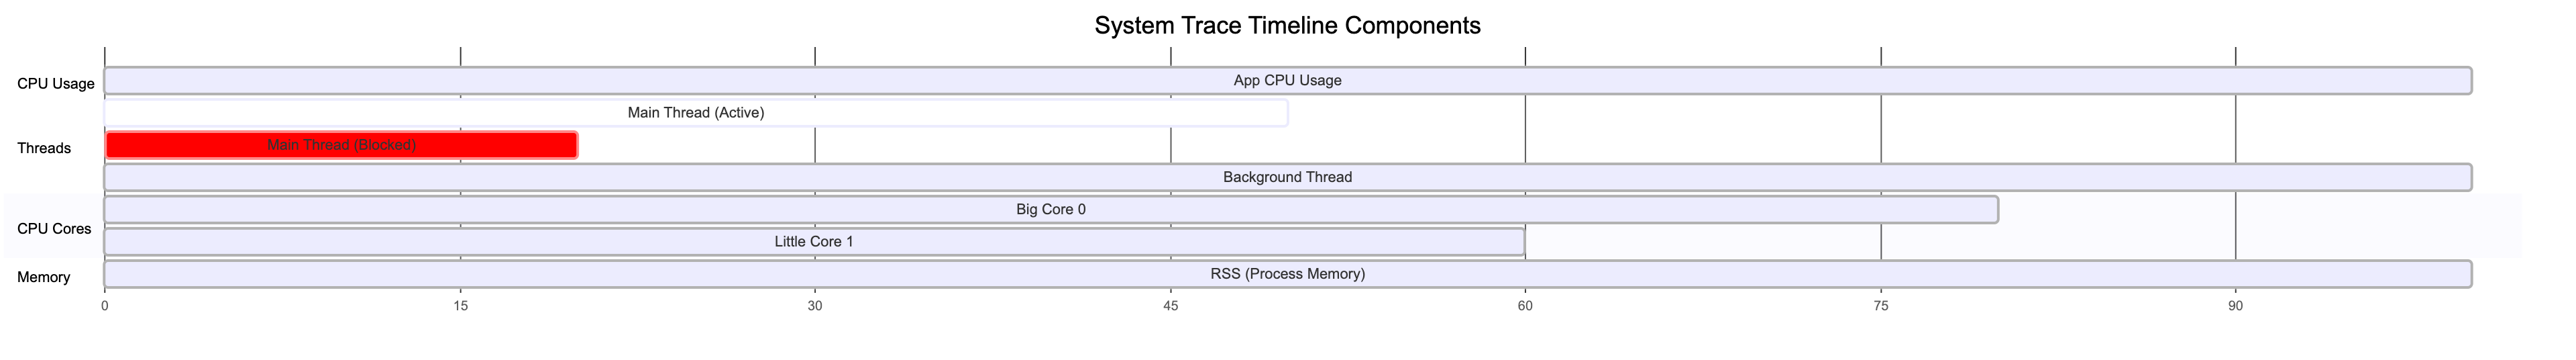
Thread Activity States:
Green (Running): Thread executing on CPU
Yellow (Runnable): Ready but waiting for CPU
Gray (Sleeping): Thread sleeping or waiting
Red: Critical sections or blocking operations
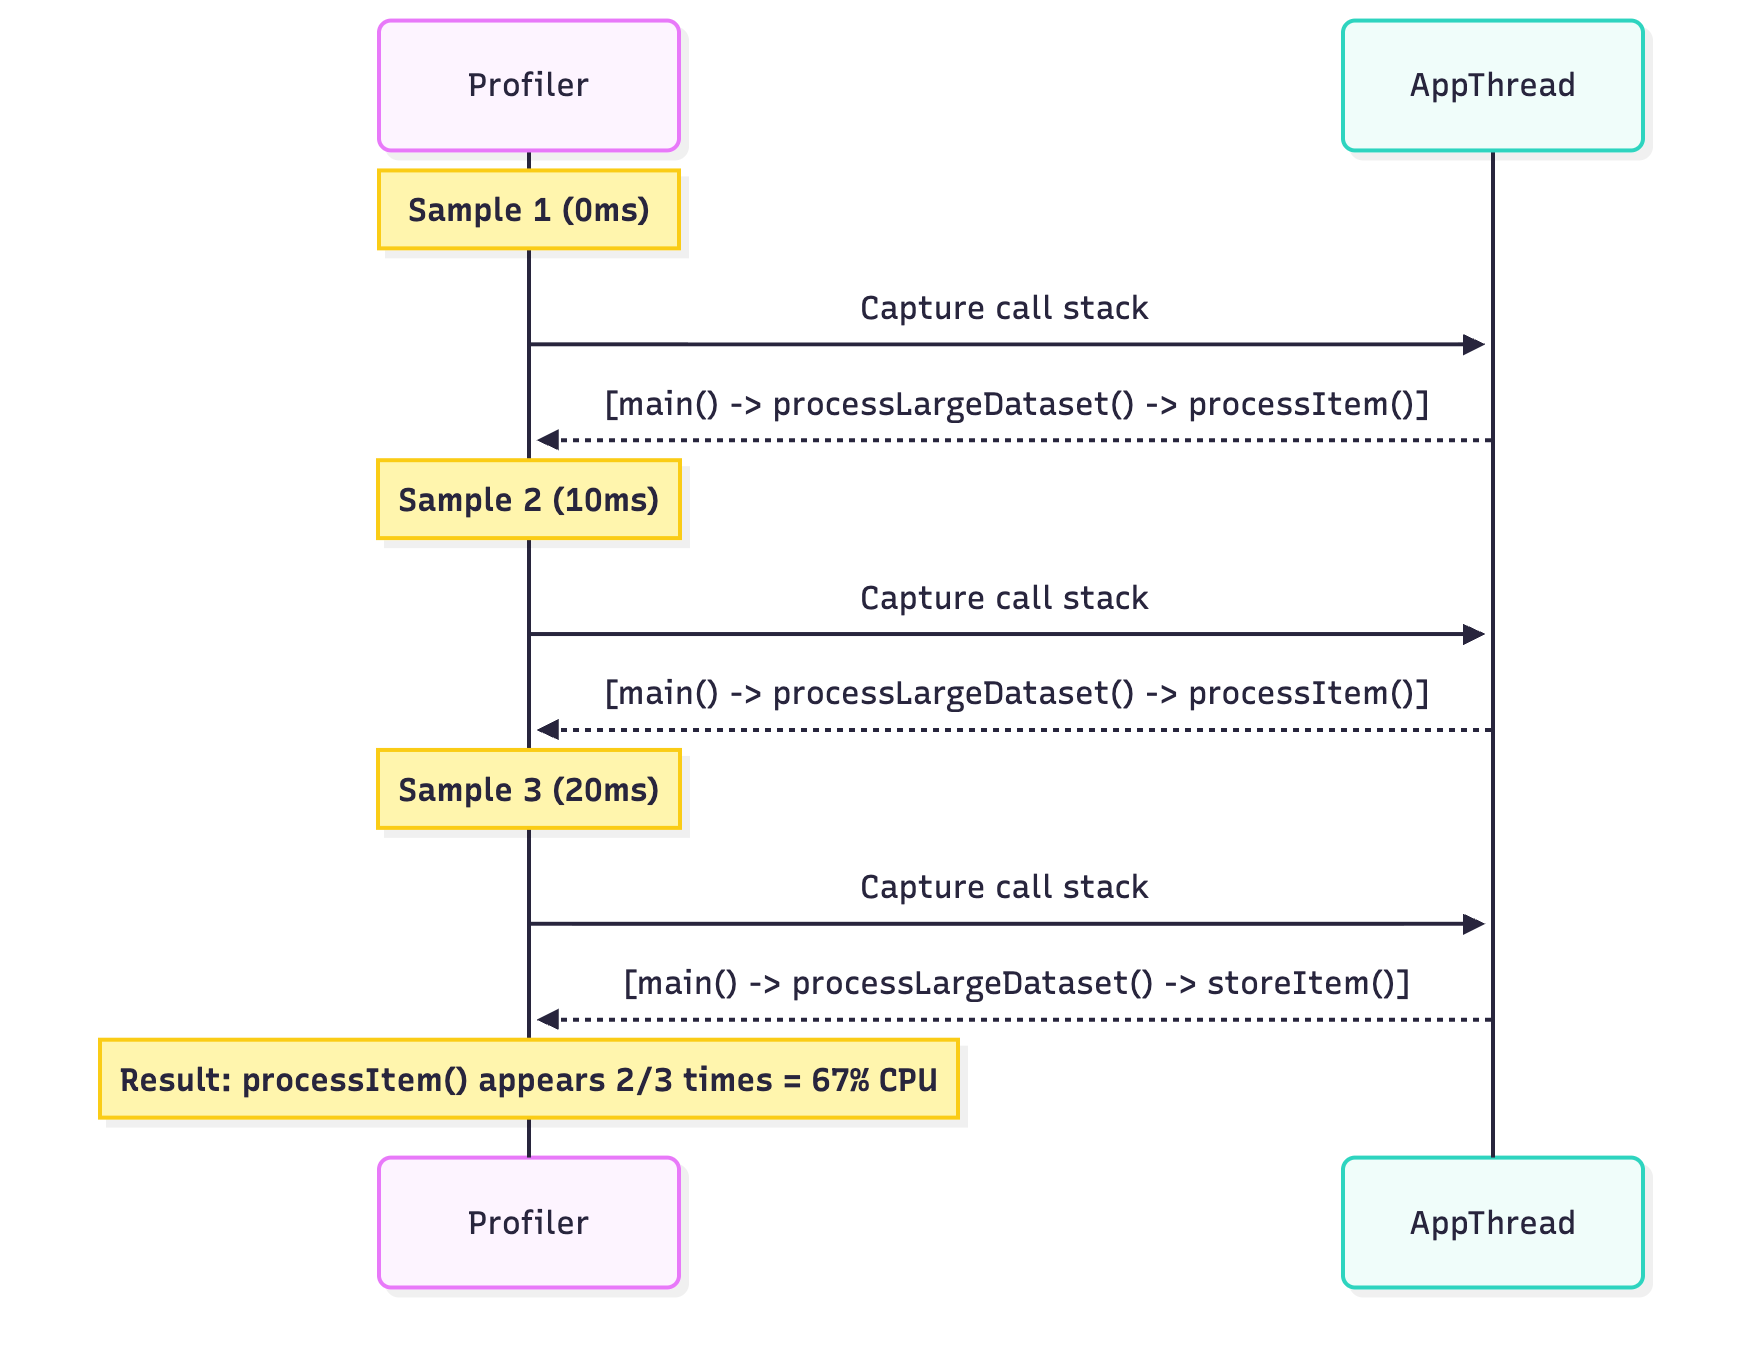
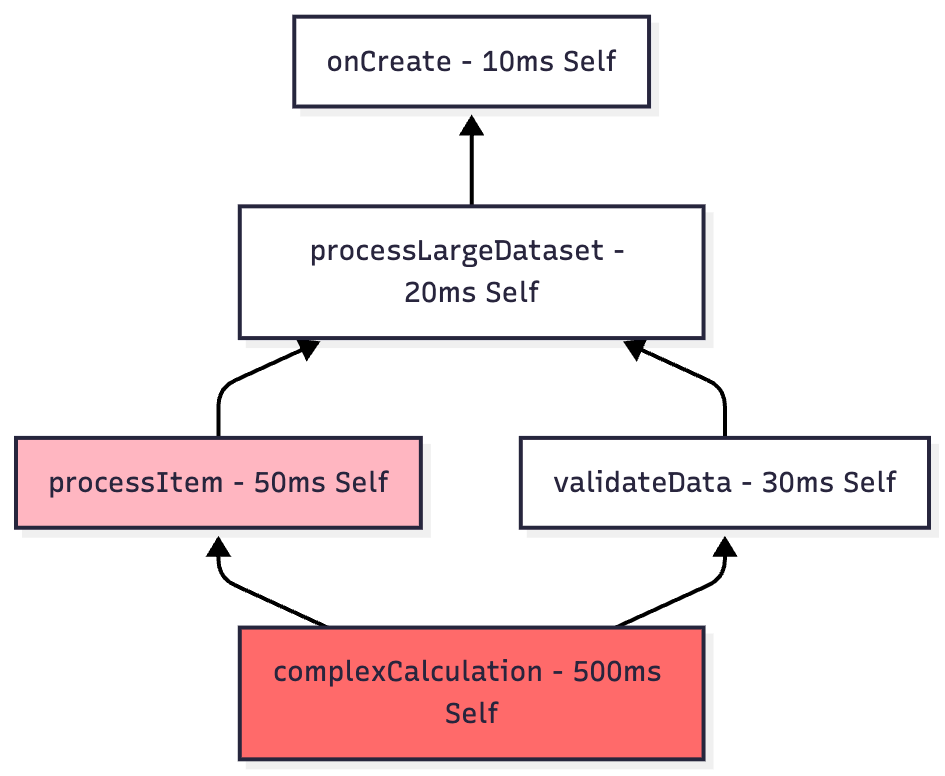
2. Callstack Sample Recording
Purpose: Sample method execution at regular intervals for a low-overhead performance overview.
Example Scenario:
class DataProcessor {
    fun processLargeDataset(data: List<DataItem>) {
        // This method will show up in samples
        data.forEach { item ->
            processItem(item)      // Frequent in samples = CPU hotspot
            validateItem(item)      // Rare in samples = not a bottleneck
            storeItem(item)        // Moderate in samples
        }
    }

    private fun processItem(item: DataItem) {
        // Complex computation - will appear frequently in samples
        repeat(1000) {
            complexCalculation(item)
        }
    }
}
How Sampling Works:
3. Trace Java/Kotlin Methods (Instrumented)
Purpose: Record every single method call with precise timing.
Warning: Keep recordings under 5 seconds due to 10-20% CPU overhead!
Example Use Case:
class ImageLoader {
    fun loadImage(url: String): Bitmap {
        // Each method call will be precisely timed
        val connection = openConnection(url)      // Measured: 50ms
        val data = downloadData(connection)       // Measured: 200ms
        val bitmap = decodeImage(data)            // Measured: 150ms
        return applyFilters(bitmap)               // Measured: 300ms
        // Total: 700ms - now you know exactly where time is spent!
    }
}
CPU Analysis Views
Top Down Tree
Shows call hierarchy from entry points downward.
Reading the Tree:
Self Time: Method’s own execution time
Children Time: Time spent in called methods
Total Time: Self + Children
Bottom Up Tree
Shows methods consuming most CPU time and their callers.
Use Case: Sort by CPU consumption to immediately identify hotspots.
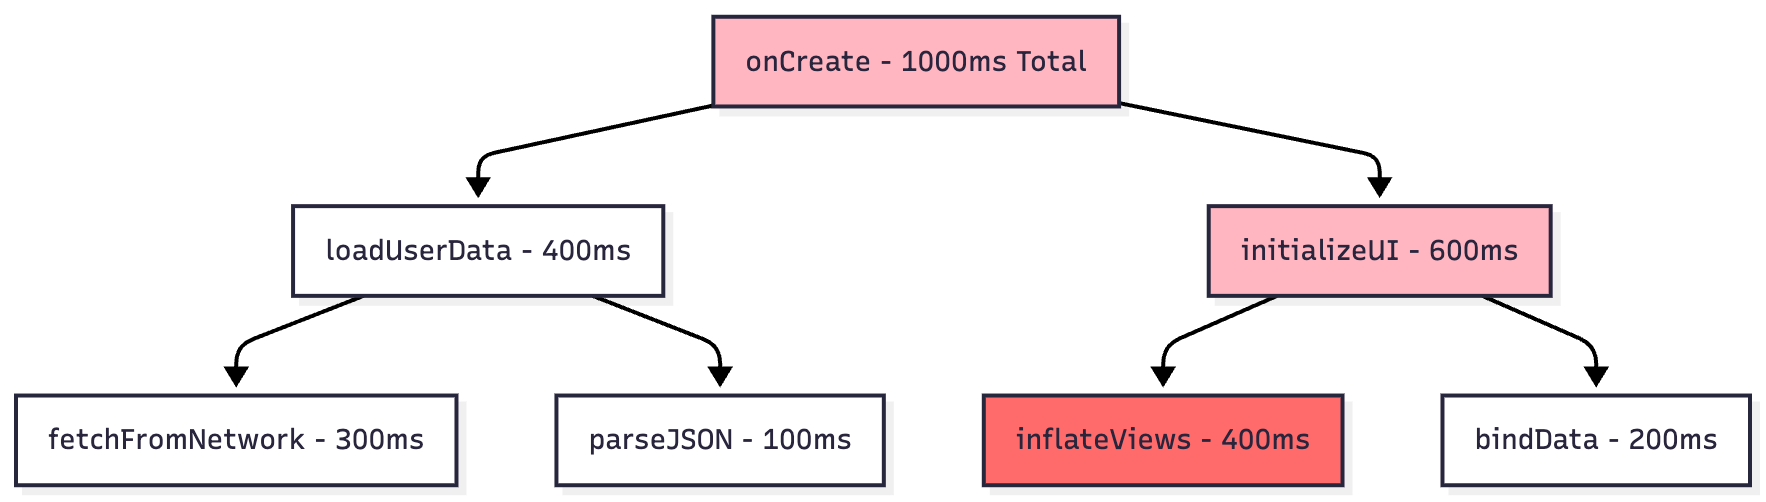
Flame Chart
Inverted call chart where wider bars indicate more CPU time.
onCreate                     [####################################] 1000ms
├─ loadUserData             [################] 400ms
│  ├─ fetchFromNetwork      [############] 300ms
│  └─ parseJSON             [####] 100ms
└─ initializeUI             [####################] 600ms
   ├─ inflateViews          [################] 400ms
   └─ bindData              [########] 200ms
Profiling Startup Performance
Configuration:
Edit Run Configuration
Go to Profiling tab
Enable “Start recording a method trace on startup“
Choose sampled Java methods (recommended)
Example Output Analysis:
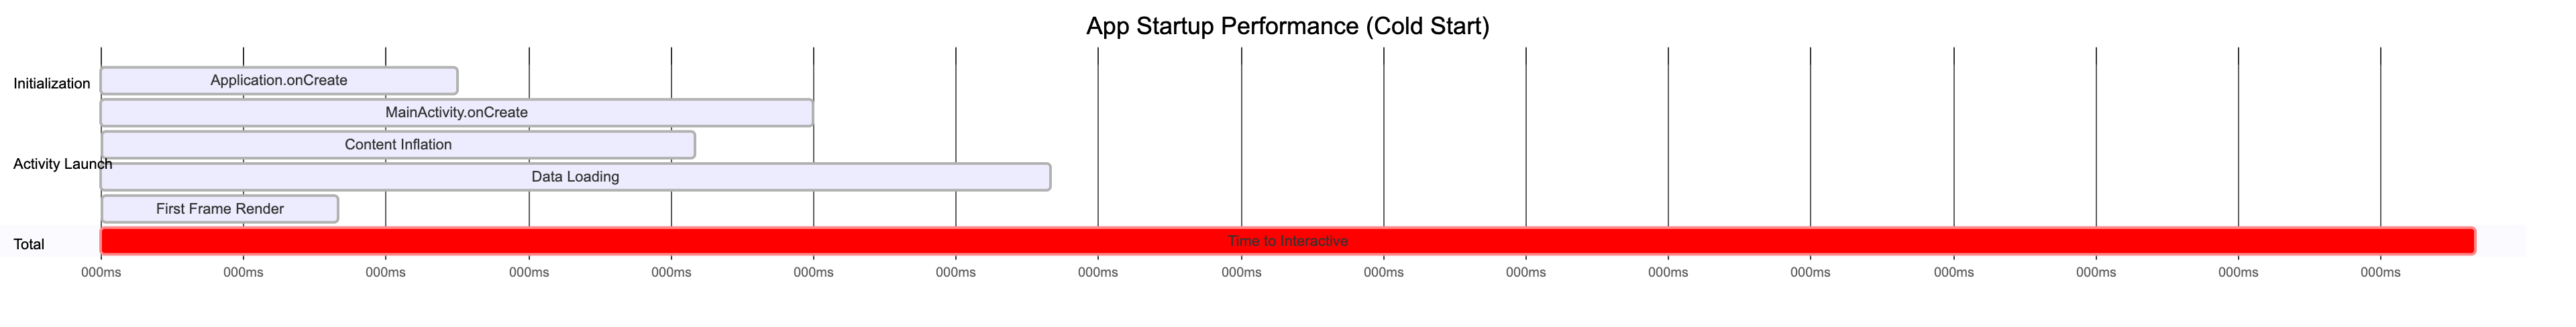
Target: Cold start should be under 500ms for good user experience.
Memory Profiler
The Memory Profiler helps identify memory leaks, excessive allocations, and garbage collection issues.
Memory Categories
pie title Memory Distribution in Typical App
    “Java/Kotlin Objects” : 45
    “Native Memory” : 25
    “Graphics/Textures” : 15
    “Stack” : 5
    “Code/Resources” : 8
    “Other” : 2
Breakdown:
Java/Kotlin: Objects allocated from Java or Kotlin code
Native: C/C++ allocations, including framework-level allocations
Graphics: GPU memory, textures, and graphics buffers
Stack: Stack memory for Java and native stacks
Code: APK, dex files, and compiled code
Others: System-managed memory
Allocation Tracking Modes

Recording Java/Kotlin Allocations
Example Scenario: Finding memory-intensive operations
class ImageGallery : AppCompatActivity() {
    private val images = mutableListOf<Bitmap>()

    override fun onCreate(savedInstanceState: Bundle?) {
        super.onCreate(savedInstanceState)

        // Start allocation recording here
        loadGalleryImages()  // Suspect this allocates too much
    }

    private fun loadGalleryImages() {
        repeat(50) { index ->
            // Each iteration allocates a large Bitmap
            val bitmap = BitmapFactory.decodeResource(
                resources,
                R.drawable.large_image
            )
            images.add(bitmap)  // Problem: keeping all in memory!
        }
    }
}
Profiler Output:

Solution:
class ImageGallery : AppCompatActivity() {
    private val imageCache = LruCache<Int, Bitmap>(
        (Runtime.getRuntime().maxMemory() / 1024 / 8).toInt()
    )

    private fun loadGalleryImages() {
        repeat(50) { index ->
            loadImageWithCaching(index)  // Much better!
        }
    }

    private fun loadImageWithCaching(index: Int) {
        val cached = imageCache.get(index)
        if (cached == null) {
            val bitmap = decodeSampledBitmap(R.drawable.large_image)
            imageCache.put(index, bitmap)
        }
    }
}
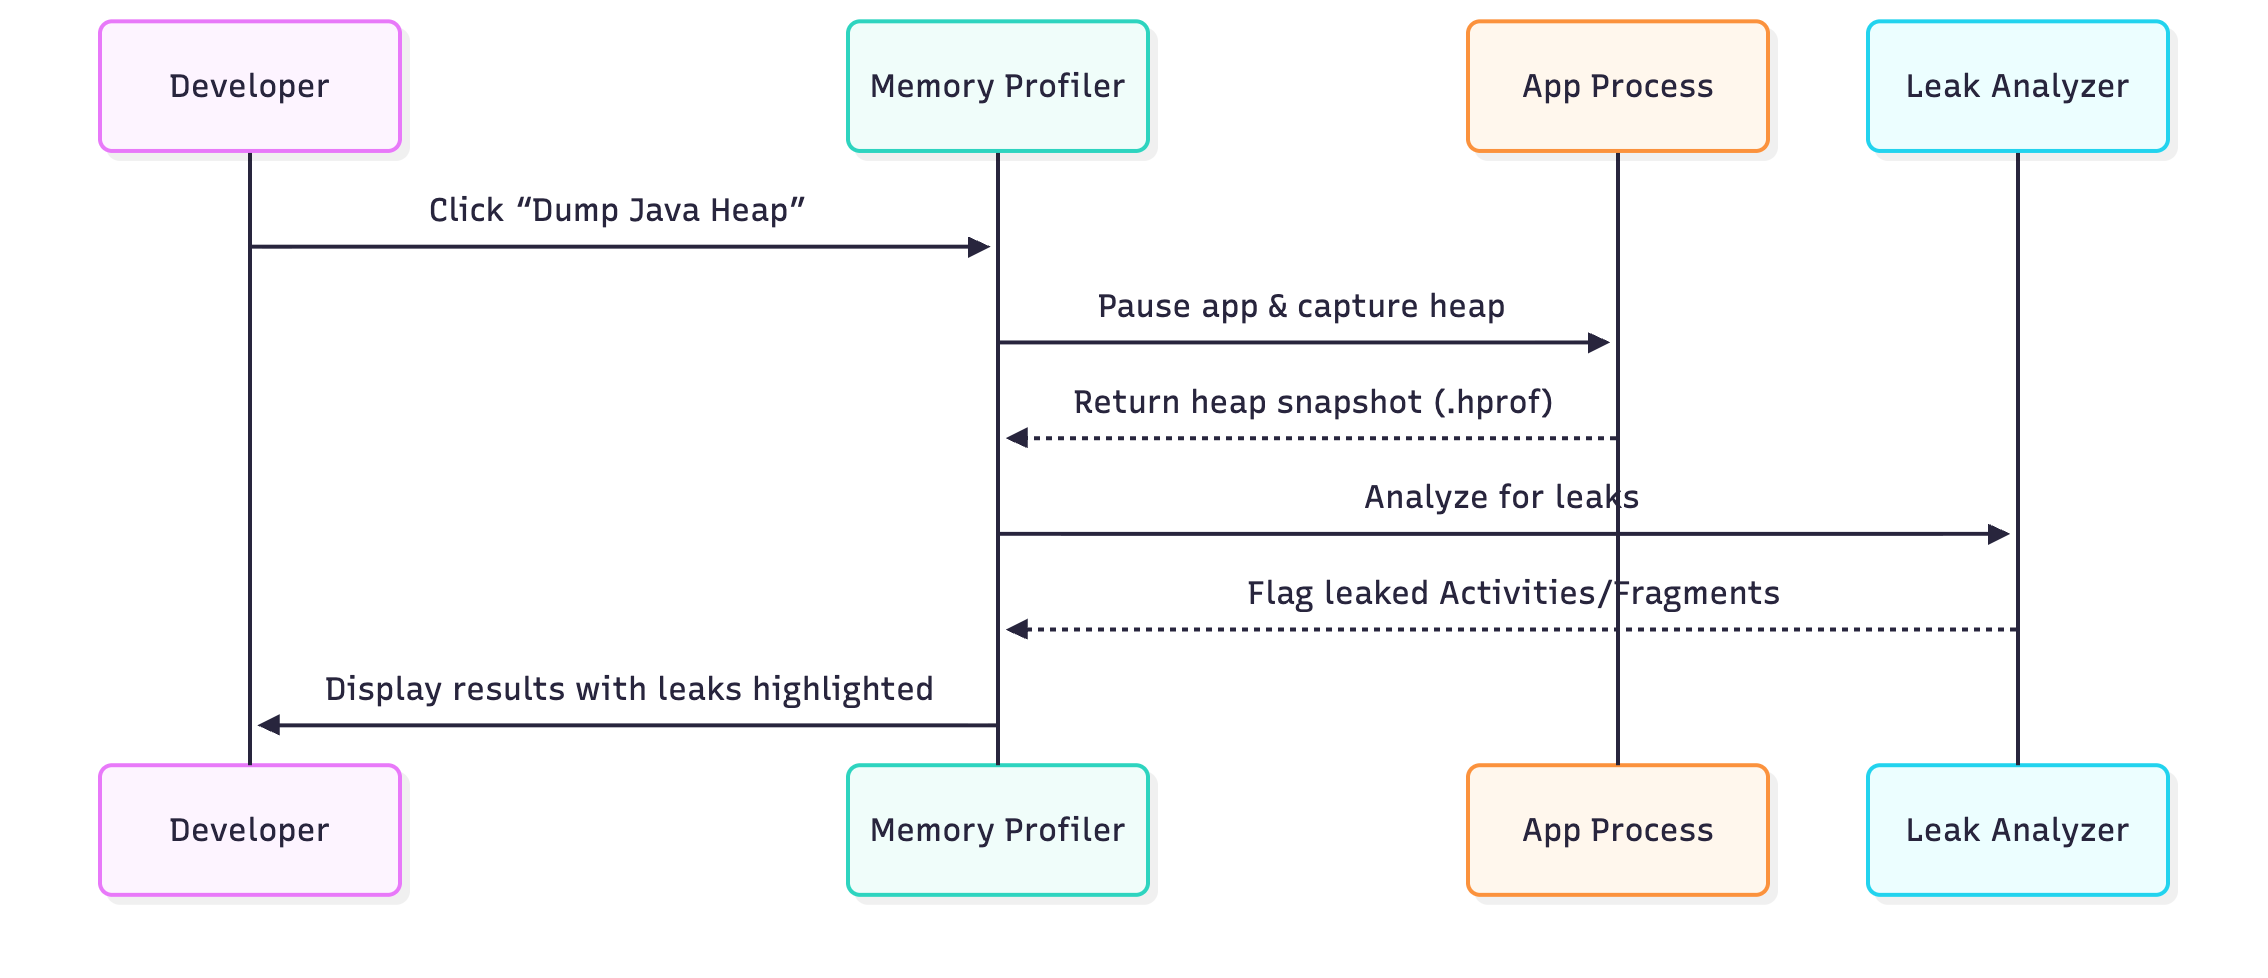
Heap Dump Analysis
Capturing Process:
Heap Dump Contents Example:
Class List View:
├─ Activity
│  ├─ MainActivity [LEAKED - 3 instances]
│  └─ SettingsActivity [OK - 1 instance]
├─ Fragment
│  └─ UserProfileFragment [LEAKED - 2 instances]
├─ Bitmap
│  └─ 15 instances, 45 MB total
└─ ArrayList
   └─ 1,247 instances, 2.3 MB total
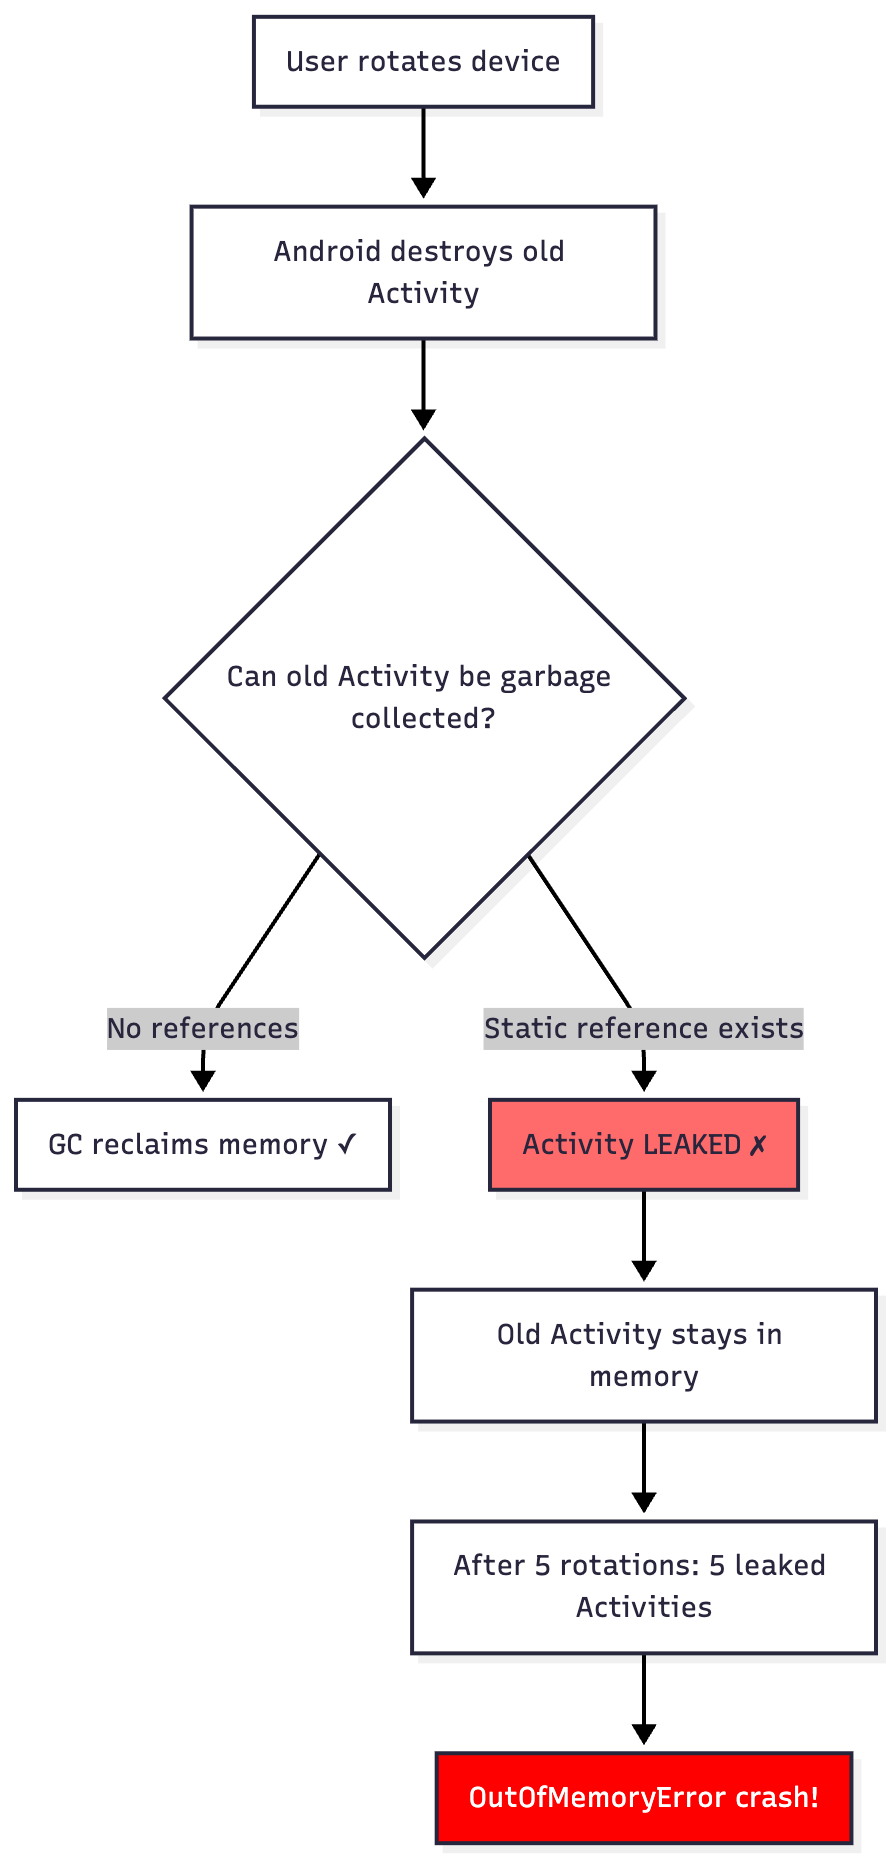
Memory Leak Detection
Common Leak Pattern:
class MainActivity : AppCompatActivity() {
    companion object {
        // LEAK: Static reference to Activity!
        var instance: MainActivity? = null
    }

    override fun onCreate(savedInstanceState: Bundle?) {
        super.onCreate(savedInstanceState)
        instance = this  // Problem: Activity can never be GC’d

        // Another leak: Non-static inner class holding Activity reference
        val handler = Handler(Looper.getMainLooper())
        handler.postDelayed({
            // This anonymous class holds reference to Activity
            updateUI()  // Activity leaked if rotation happens!
        }, 10000)
    }
}
Memory Leak Flow:
Fixed Version:
class MainActivity : AppCompatActivity() {
    private val handler = Handler(Looper.getMainLooper())
    private val updateRunnable = Runnable {
        if (!isFinishing && !isDestroyed) {
            updateUI()
        }
    }

    override fun onCreate(savedInstanceState: Bundle?) {
        super.onCreate(savedInstanceState)
        handler.postDelayed(updateRunnable, 10000)
    }

    override fun onDestroy() {
        super.onDestroy()
        handler.removeCallbacks(updateRunnable)  // Clean up!
    }
}
Garbage Collection Analysis
GC Event Visualization:
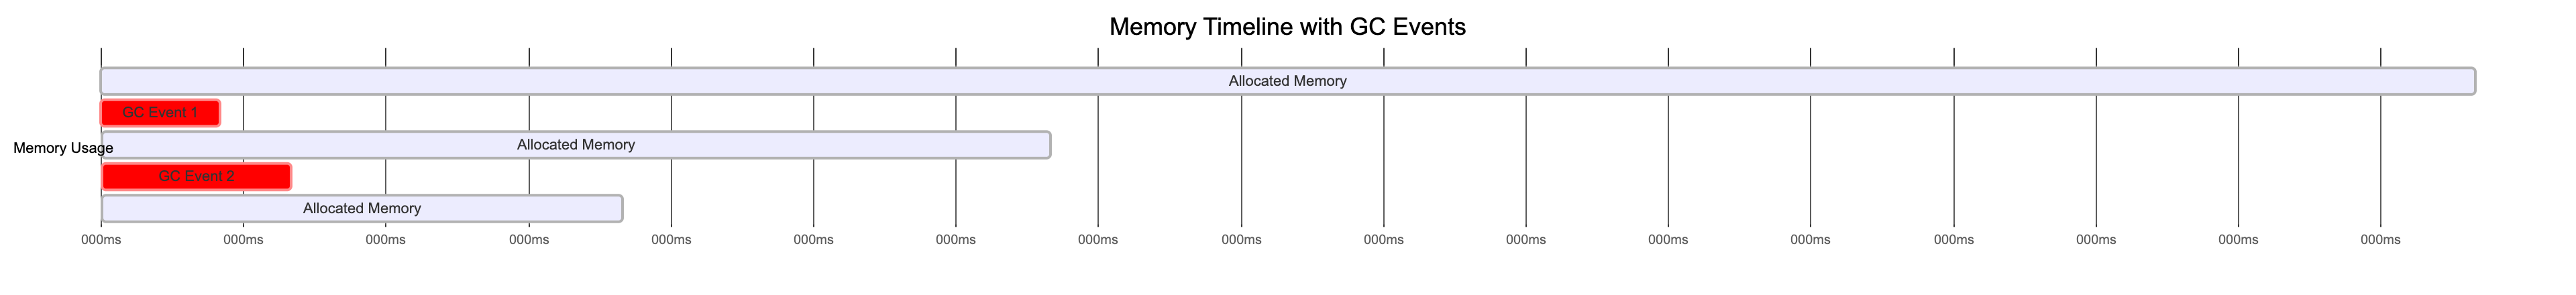
Reading GC Logs:
GC_CONCURRENT freed 65595(3MB)+9(4MB), 38MB/58MB, paused 1.195ms total 87.219msInterpretation:
freed 65595(3MB): Reclaimed 65,595 objects totaling 3MB
+9(4MB): Large object space freed 9 objects (4MB)
38MB/58MB: 38MB alive / 58MB total heap after GC
paused 1.195ms: App frozen for 1.2ms (excellent!)
total 87.219ms: Complete GC duration
Performance Impact:
GC Frequency Impact Action Needed Every few seconds ✗ Severe jank Fix immediately Every 10-30 seconds ⚠ Minor stutters Investigate Every minute+ ✓ Normal No action
Native Memory Profiling
Why It Matters:
Even apps without C++ code use native memory:
class ImageProcessor {
    fun loadLargeImage(): Bitmap {
        // This allocates native memory even though it’s Kotlin!
        val bitmap = BitmapFactory.decodeFile(”/path/to/huge_image.jpg”)
        // Bitmap pixel data stored in native heap
        return bitmap
    }
}
Native Allocation Recording:
Native Allocations:
├─ malloc(): 1,234 calls → 18.5 MB
├─ new: 567 calls → 8.2 MB
├─ free(): 890 calls → -12.1 MB
└─ delete: 234 calls → -3.9 MB

Remaining: 10.7 MB native memory
Network Profiler
The Network Profiler displays real-time network activity, helping optimize data usage and debug API issues.
Supported Libraries
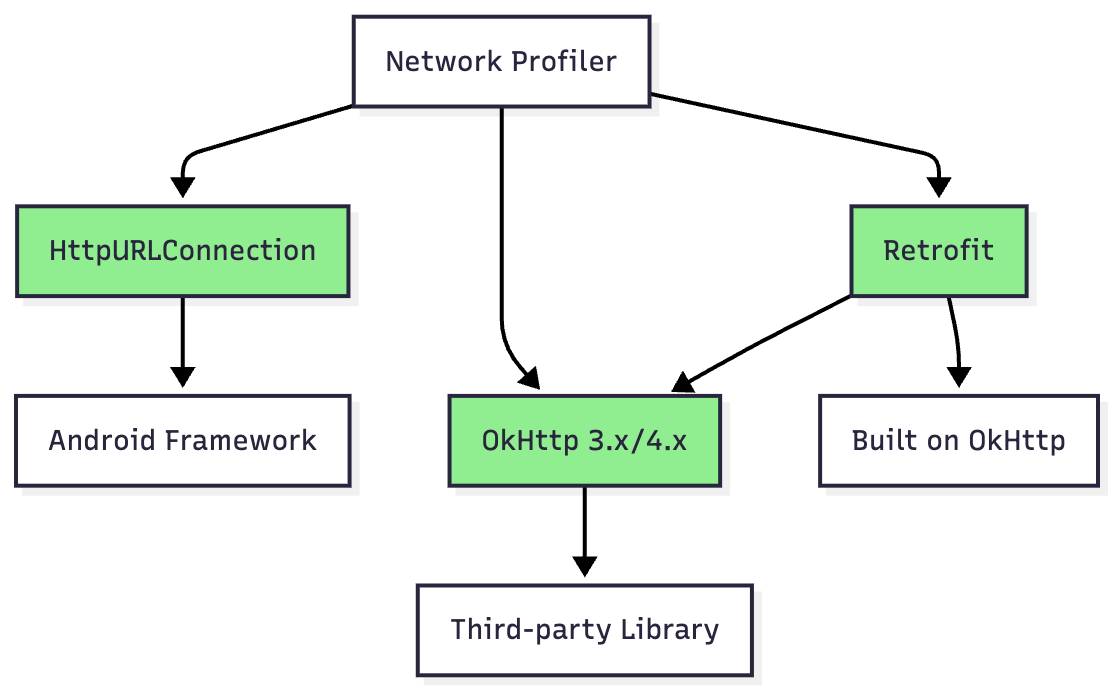
Note: Other networking libraries (Volley, AndroidAsync) are not officially supported.
Network Timeline Analysis
Example Timeline:
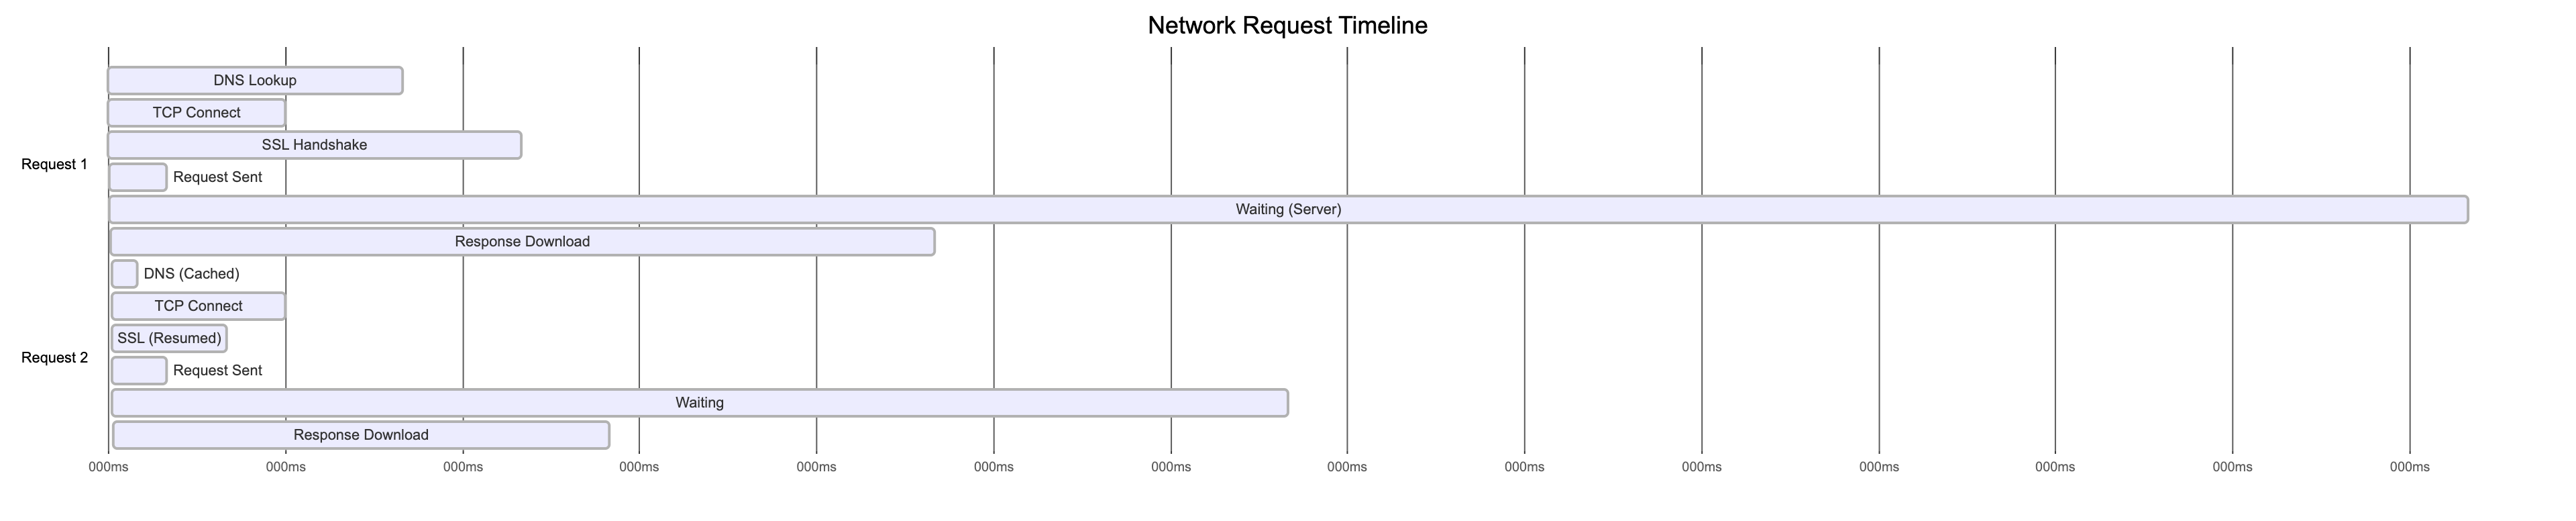
Performance Insights:
Request 1: 700ms total (400ms server wait is bottleneck)
Request 2: 350ms total (DNS cache saved 45ms)
Request Details Inspector
Example API Call:
// Making a request
val client = OkHttpClient()
val request = Request.Builder()
    .url(”https://api.example.com/users/123”)
    .header(”Authorization”, “Bearer token123”)
    .build()

client.newCall(request).enqueue(object : Callback {
    override fun onResponse(call: Call, response: Response) {
        // Response: 200 OK, 15 KB, 450ms
    }
})
Profiler Display:
Connection View:
┌─────────────────────────────────────────────┐
│ URL: https://api.example.com/users/123      │
│ Method: GET                                 │
│ Status: 200 OK                              │
│ Size: 15.2 KB                               │
│ Time: 450ms                                 │
└─────────────────────────────────────────────┘

Timeline Breakdown:
├─ DNS Lookup:      5ms
├─ Connecting:      32ms
├─ SSL:             68ms
├─ Sending:         8ms
├─ Waiting:         287ms ⚠ (slow backend)
└─ Receiving:       50ms

Request Headers:
├─ Authorization: Bearer token123
├─ User-Agent: Dalvik/2.1.0
└─ Accept-Encoding: gzip

Response Headers:
├─ Content-Type: application/json
├─ Content-Length: 15234
└─ Cache-Control: max-age=3600

Response Body (Formatted JSON):
{
  “id”: 123,
  “name”: “John Doe”,
  “email”: “john@example.com”,
  ...
}
Network Rules and Interception
Feature (Android Studio Flamingo+): Intercept and modify network traffic without proxy tools!
Example Use Case: Testing Error Handling
// Your production code
fun fetchUserProfile(userId: Int) {
    api.getUser(userId).enqueue { response ->
        when (response.code()) {
            200 -> showUserProfile(response.body())
            404 -> showUserNotFound()      // How to test this?
            500 -> showServerError()        // And this?
            else -> showGenericError()
        }
    }
}
Network Rule Configuration:
Rule 1: Test 404 Error
├─ URL Pattern: */users/*
├─ Override Response Code: 404
├─ Override Body: {”error”: “User not found”}
└─ Active: ✓

Rule 2: Test Slow Network
├─ URL Pattern: */users/*
├─ Add Delay: 5000ms
├─ Override Response Code: 200
└─ Active: ✗ (disabled for now)
Benefits:
Test error scenarios without backend changes
Simulate slow networks
Reproduce race conditions
Test offline behavior
OkHttp Logging Integration
Implementation:
// Add interceptor for detailed logging
class NetworkModule {
    fun provideOkHttpClient(): OkHttpClient {
        val logging = HttpLoggingInterceptor().apply {
            level = when {
                BuildConfig.DEBUG -> HttpLoggingInterceptor.Level.BODY
                else -> HttpLoggingInterceptor.Level.NONE
            }
        }

        return OkHttpClient.Builder()
            .addInterceptor(logging)
            .connectTimeout(30, TimeUnit.SECONDS)
            .readTimeout(30, TimeUnit.SECONDS)
            .build()
    }
}
Log Levels:
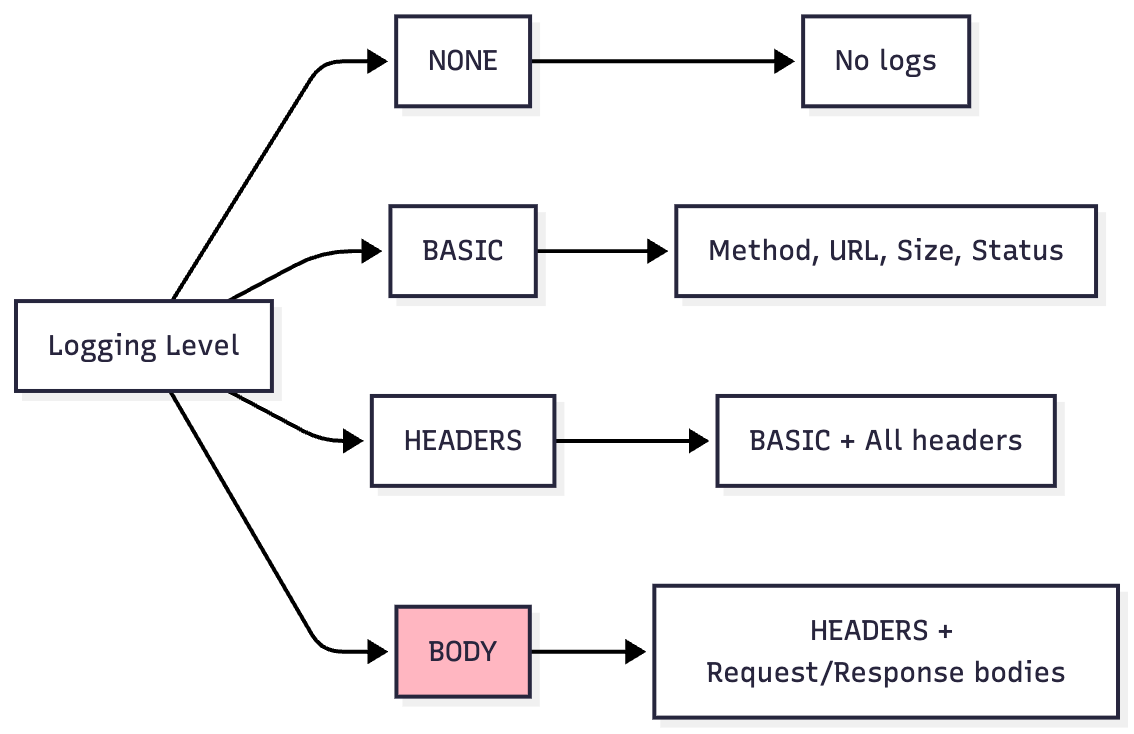
Example Output (BODY level):
--> GET https://api.example.com/users/123
Authorization: Bearer token123
--> END GET

<-- 200 OK https://api.example.com/users/123 (450ms)
Content-Type: application/json
Content-Length: 15234

{”id”:123,”name”:”John Doe”,”email”:”john@example.com”}
<-- END HTTP
Power/Energy Profiler
The Power Profiler visualizes energy consumption by app components and system resources.
On-Device Power Rails Monitor (ODPM)
Supported Devices: Pixel 6+ running Android 10+
pie title Power Consumption Breakdown
    “Display” : 35
    “CPU (All Cores)” : 25
    “GPU” : 15
    “Cellular/WiFi” : 12
    “Memory” : 8
    “Camera/Sensors” : 5
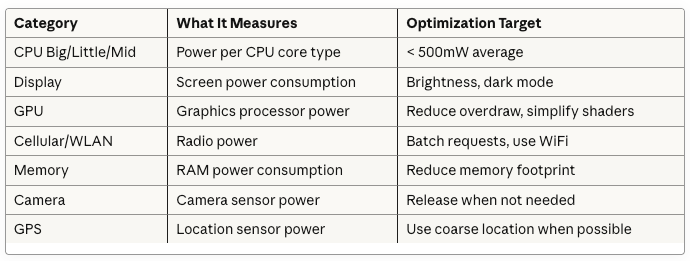
Power Rails Categories:
Power Profiling Workflow
Scenario: Comparing Download Strategies
// Strategy A: Individual downloads (power hungry)
fun downloadImagesIndividually() {
    images.forEach { imageUrl ->
        // Each request wakes up cellular radio
        networkClient.download(imageUrl) { bitmap ->
            cache.put(imageUrl, bitmap)
        }
        // Radio stays active between requests
    }
}

// Strategy B: Batched download (power efficient)
fun downloadImagesBatched() {
    // Single request for all images
    networkClient.downloadBatch(images) { bitmaps ->
        bitmaps.forEachIndexed { index, bitmap ->
            cache.put(images[index], bitmap)
        }
    }
    // Radio can sleep after single burst
}
Power Profile Comparison:
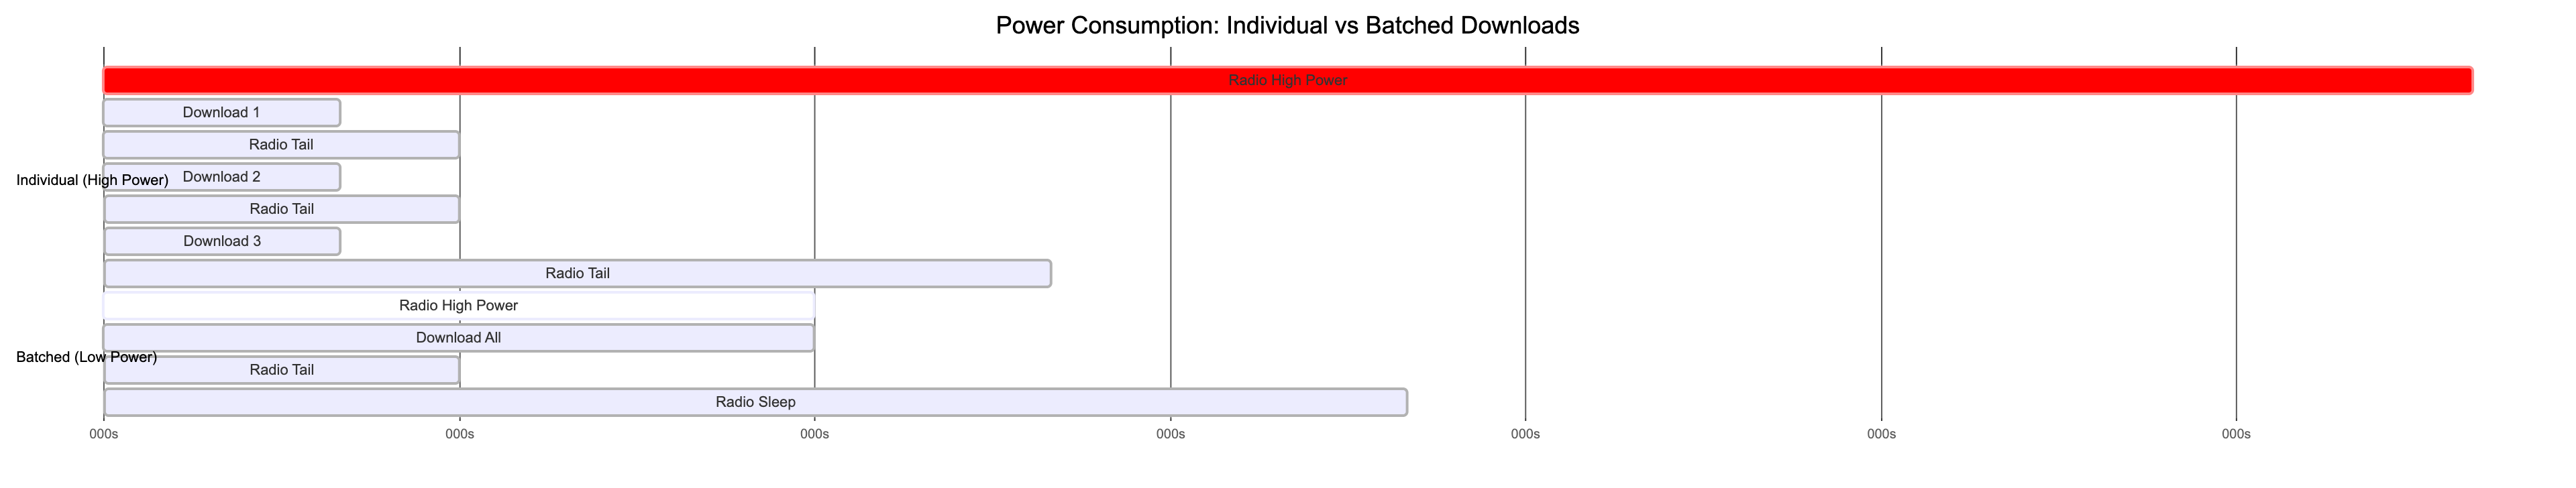
Result: Batched approach uses 60% less energy!
Wake Locks and Background Work
Problem: Wake Lock Abuse
// BAD: Holding wake lock indefinitely
class DataSyncService : Service() {
    private lateinit var wakeLock: PowerManager.WakeLock

    override fun onCreate() {
        super.onCreate()
        val powerManager = getSystemService(Context.POWER_SERVICE) as PowerManager
        wakeLock = powerManager.newWakeLock(
            PowerManager.PARTIAL_WAKE_LOCK,
            “DataSync::WakeLock”
        )
        wakeLock.acquire()  // Problem: Never released!
    }

    fun syncData() {
        // Long-running sync
        Thread.sleep(30000)  // Device can’t sleep for 30 seconds!
    }
}
Profiler Shows:
Wake Locks Timeline:
├─ 00:00 - DataSync::WakeLock ACQUIRED
├─ 00:30 - Still held... ⚠
├─ 01:00 - Still held... ⚠
├─ 01:30 - Still held... ⚠
└─ Battery drain: 5% in 90 minutes (should be <1%)
Solution: Use WorkManager
// GOOD: Efficient background work
class DataSyncWorker(
    context: Context,
    params: WorkerParameters
) : CoroutineWorker(context, params) {

    override suspend fun doWork(): Result {
        // WorkManager handles wake locks efficiently
        return try {
            syncData()
            Result.success()
        } catch (e: Exception) {
            Result.retry()
        }
        // Wake lock automatically released!
    }

    private suspend fun syncData() {
        withContext(Dispatchers.IO) {
            // Perform sync
        }
    }
}

// Schedule work
val syncRequest = PeriodicWorkRequestBuilder<DataSyncWorker>(
    repeatInterval = 15,
    repeatIntervalTimeUnit = TimeUnit.MINUTES
)
    .setConstraints(
        Constraints.Builder()
            .setRequiredNetworkType(NetworkType.CONNECTED)
            .setRequiresBatteryNotLow(true)  // Power-aware!
            .build()
    )
    .build()

WorkManager.getInstance(context).enqueue(syncRequest)
Advanced Features
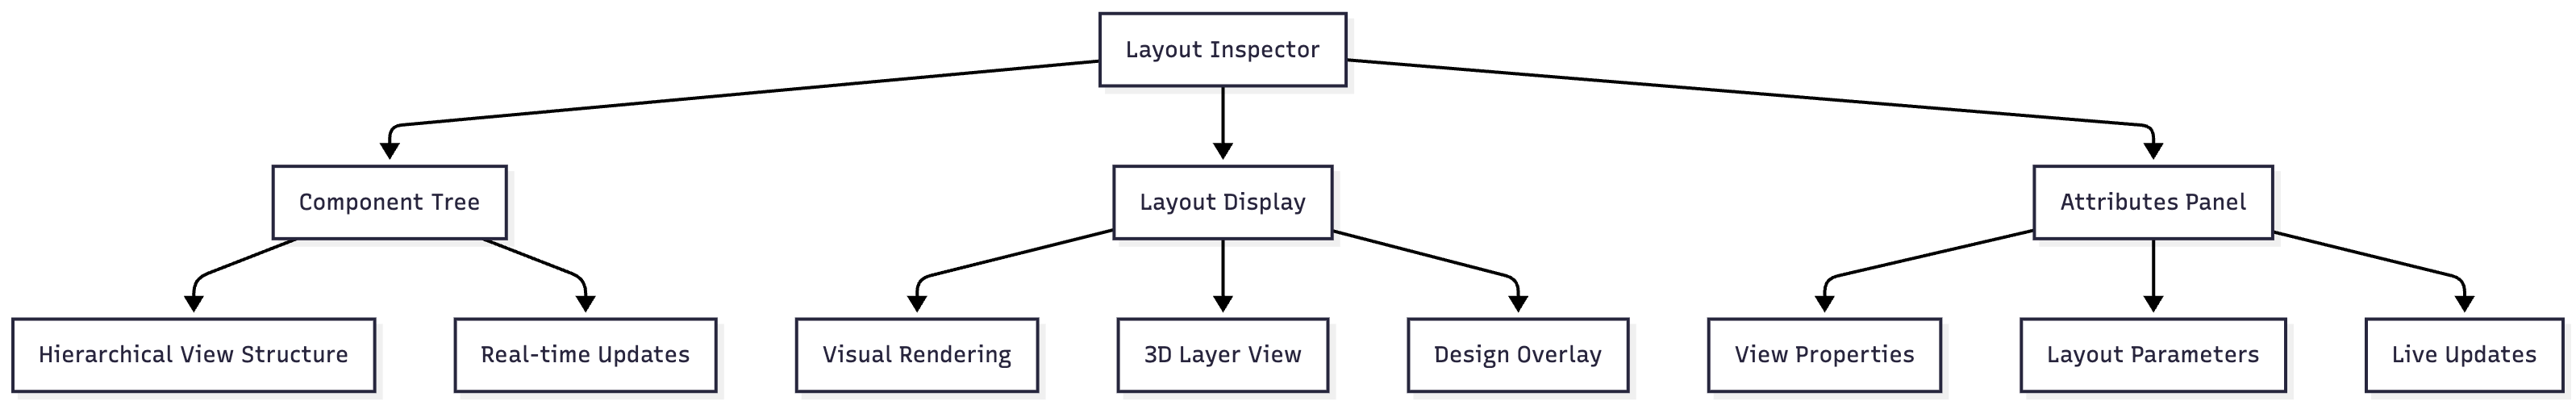
Layout Inspector: UI Debugging
The Layout Inspector debugs app UI by showing view hierarchy and 3D rendering.
Opening Layout Inspector:
Tools > Layout Inspector from menu
Available when app is running
Interface Components:
Example: Debugging Layout Performance
<!-- activity_main.xml - PROBLEM: Deep hierarchy -->
<LinearLayout>
    <RelativeLayout>
        <FrameLayout>
            <LinearLayout>
                <RelativeLayout>
                    <TextView android:text=”Hello World” />
                </RelativeLayout>
            </LinearLayout>
        </FrameLayout>
    </RelativeLayout>
</LinearLayout>
Component Tree View:
Component Tree (Depth: 6 layers ⚠):
└─ LinearLayout
   └─ RelativeLayout
      └─ FrameLayout
         └─ LinearLayout
            └─ RelativeLayout
               └─ TextView “Hello World”

Performance Impact: ~12ms layout time (Target: <2ms)
Optimized Version:
<!-- Flattened hierarchy -->
<androidx.constraintlayout.widget.ConstraintLayout>
    <TextView
        android:text=”Hello World”
        app:layout_constraintTop_toTopOf=”parent”
        app:layout_constraintStart_toStartOf=”parent” />
</androidx.constraintlayout.widget.ConstraintLayout>
New Component Tree:
Component Tree (Depth: 2 layers ✓):
└─ ConstraintLayout
   └─ TextView “Hello World”

Performance Impact: <1ms layout time (Excellent!)
3D View for Overdraw Detection:

Overdraw Analysis:
0x overdraw (white): Ideal
1x overdraw (blue): Acceptable
2x overdraw (green): Concerning
3x overdraw (pink): Bad
4x+ overdraw (red): Critical - fix immediately!
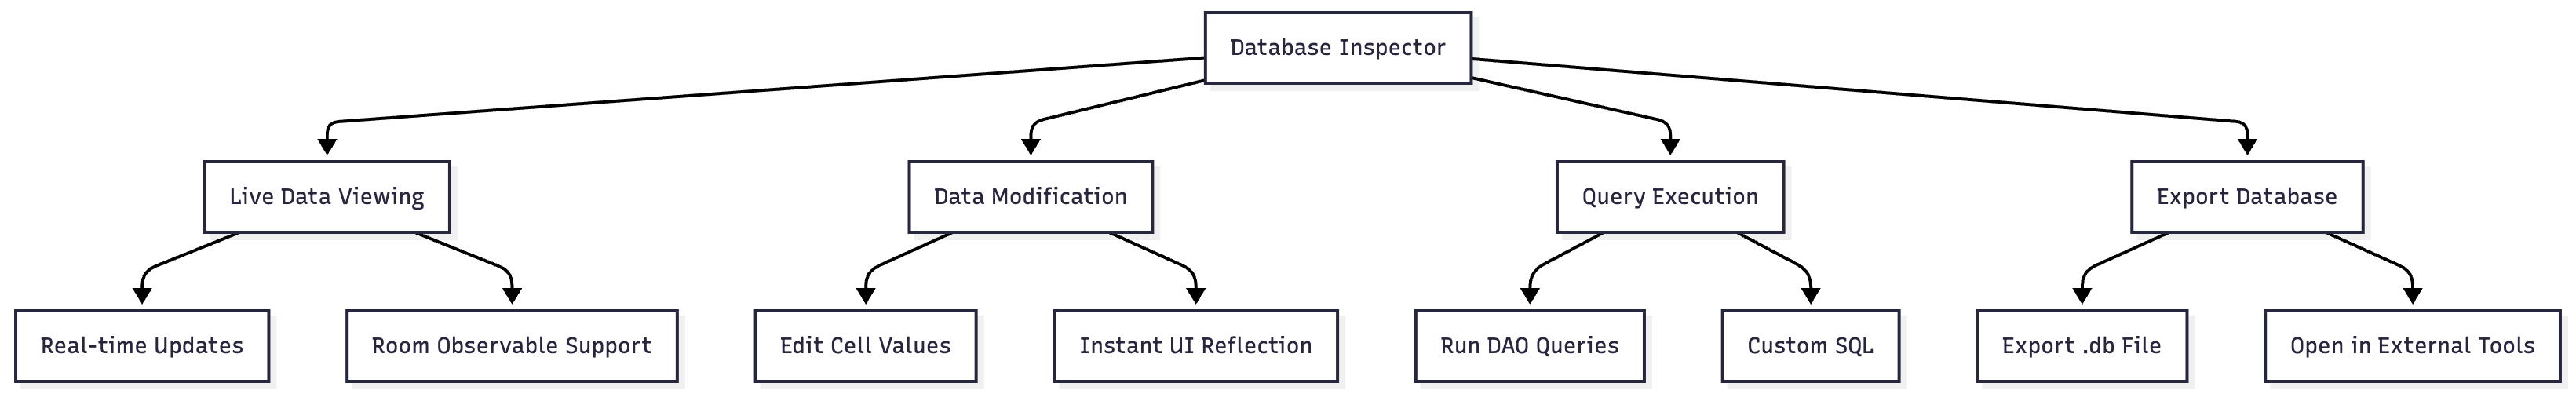
Database Inspector: Runtime Database Debugging
The Database Inspector inspects, queries, and modifies app databases while running.
Requirements:
Android Studio 4.1+
Device running API 26+ for full features
Works with SQLite and Room databases
Opening Database Inspector:
View > Tool Windows > App Inspection > Database Inspector
Features Overview:
Example: Debugging User Data
// Room Database
@Database(entities = [User::class], version = 1)
abstract class AppDatabase : RoomDatabase() {
    abstract fun userDao(): UserDao
}

@Dao
interface UserDao {
    @Query(”SELECT * FROM users WHERE age > :minAge ORDER BY name”)
    fun getUsersOlderThan(minAge: Int): Flow<List<User>>

    @Insert
    suspend fun insertUser(user: User)

    @Query(”DELETE FROM users WHERE id = :userId”)
    suspend fun deleteUser(userId: Int)
}

@Entity(tableName = “users”)
data class User(
    @PrimaryKey(autoGenerate = true) val id: Int = 0,
    val name: String,
    val email: String,
    val age: Int
)
Database Inspector View:
Databases:
└─ app_database.db
   ├─ users (15 rows)
   ├─ posts (47 rows)
   └─ comments (203 rows)

Table: users
┌────┬──────────┬────────────────────┬─────┐
│ id │ name     │ email              │ age │
├────┼──────────┼────────────────────┼─────┤
│ 1  │ Alice    │ alice@example.com  │ 28  │
│ 2  │ Bob      │ bob@example.com    │ 35  │
│ 3  │ Charlie  │ charlie@ex.com     │ 22  │ ← Double-click to edit!
└────┴──────────┴────────────────────┴─────┘

Live updates: ✓ (auto-refresh on changes)
Running DAO Queries:
In your UserDao.kt file, you’ll see gutter icons next to @Query annotations:
@Dao
interface UserDao {
    @Query(”SELECT * FROM users WHERE age > :minAge ORDER BY name”)
    //     ▶ Run SQLite statement in Database Inspector
    fun getUsersOlderThan(minAge: Int): Flow<List<User>>
}
Click the icon → Enter parameter minAge = 25 → See results instantly!
Custom Query Execution:
-- Click “Open New Query” tab in Database Inspector

-- Find users with specific email domain
SELECT * FROM users WHERE email LIKE ‘%@example.com’;

-- Update user age
UPDATE users SET age = 30 WHERE id = 3;

-- Complex join query
SELECT u.name, COUNT(p.id) as post_count
FROM users u
LEFT JOIN posts p ON u.id = p.user_id
GROUP BY u.id
ORDER BY post_count DESC;
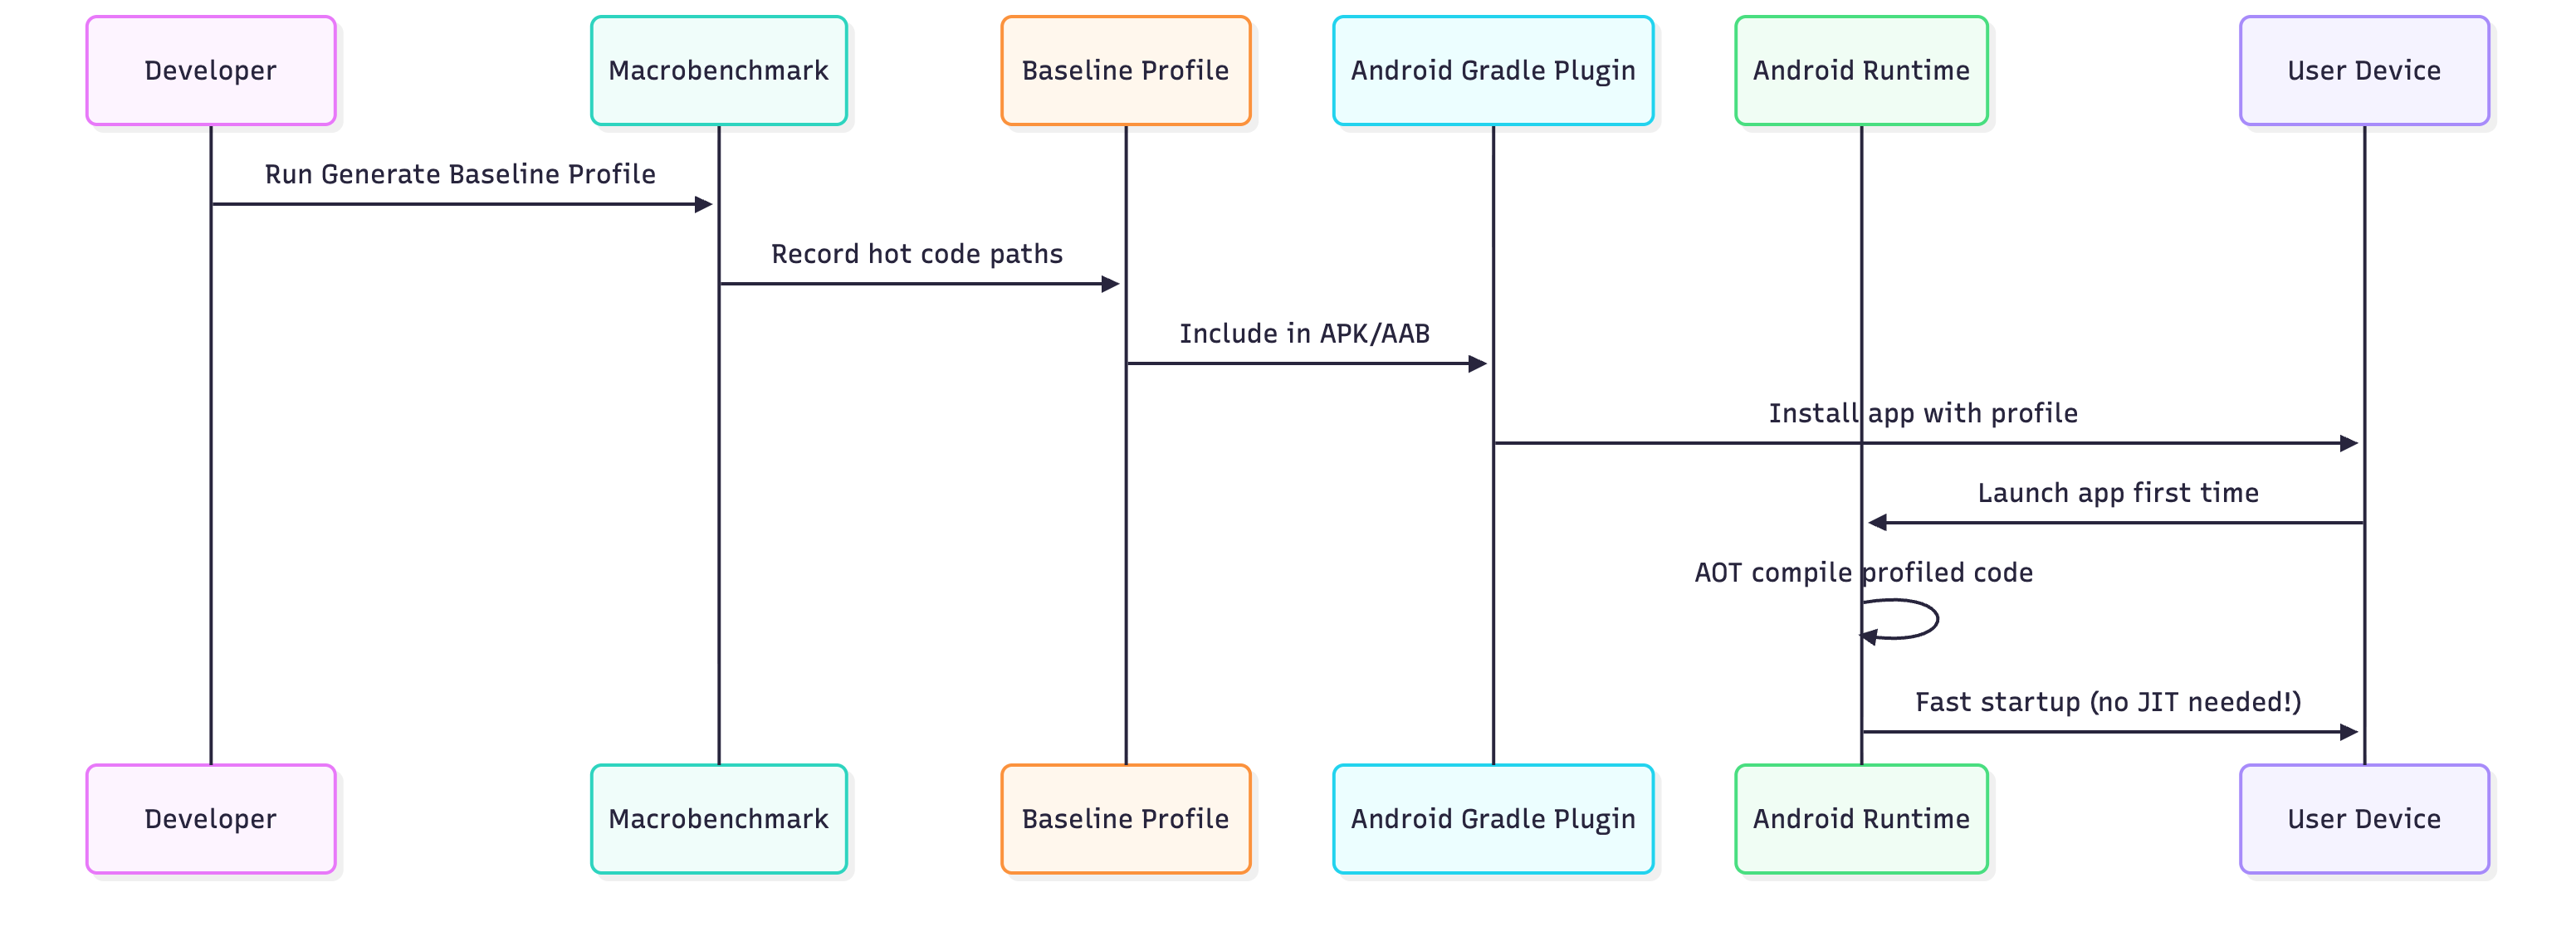
Baseline Profiles: Startup Optimization
What Are Baseline Profiles?
Baseline Profiles pre-compile critical code paths for faster app startup and execution, achieving 20-30% speed improvement from first launch.
How They Work:
Creating Baseline Profiles (Android Studio Iguana+):
Create Module:
File > New > New Module > Baseline Profile
Generated Code:
// baselineprofile/src/main/java/BaselineProfileGenerator.kt
@RunWith(AndroidJUnit4::class)
class BaselineProfileGenerator {
    @get:Rule
    val rule = BaselineProfileRule()

    @Test
    fun generate() = rule.collect(
        packageName = “com.example.myapp”,
        profileBlock = {
            // Simulate user journey
            pressHome()
            startActivityAndWait()

            // Navigate through critical paths
            device.wait(Until.hasObject(By.text(”Home”)), 5000)
            device.findObject(By.text(”Profile”)).click()
            device.wait(Until.hasObject(By.text(”Settings”)), 5000)
            device.findObject(By.text(”Settings”)).click()
        }
    )
}
Generate:
Run Generate Baseline Profile from Run dialog
Profile automatically included in release builds
Performance Comparison:
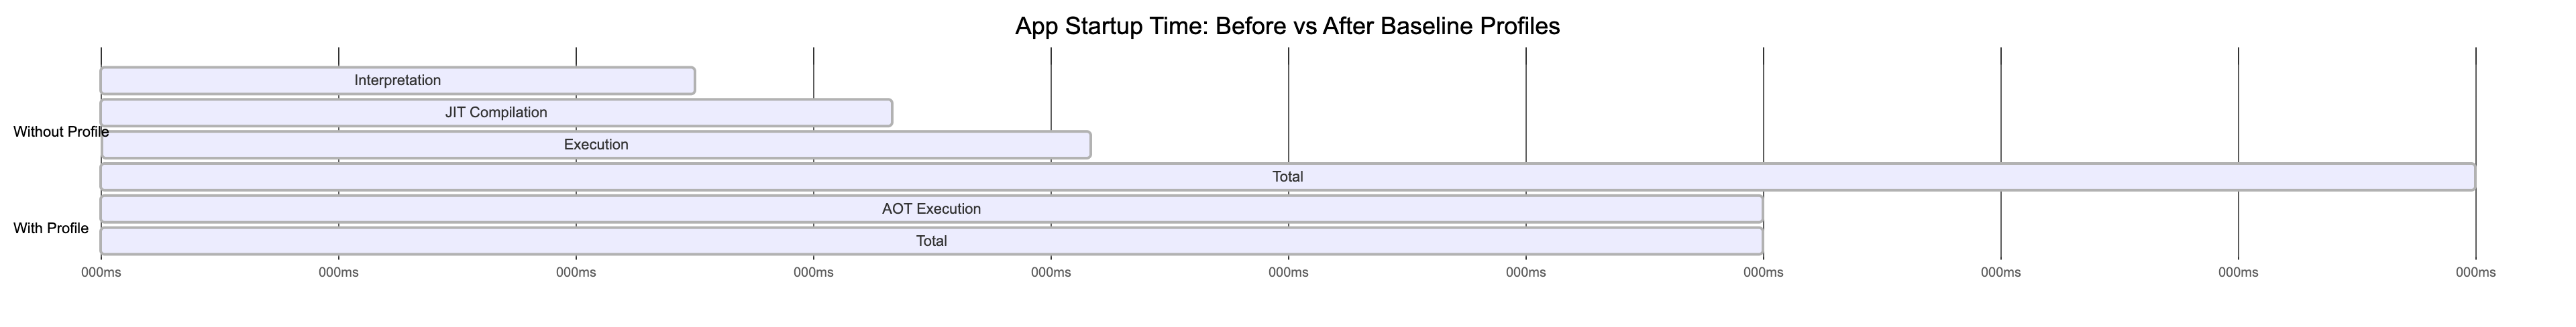
Result: 30% faster startup (600ms → 420ms)
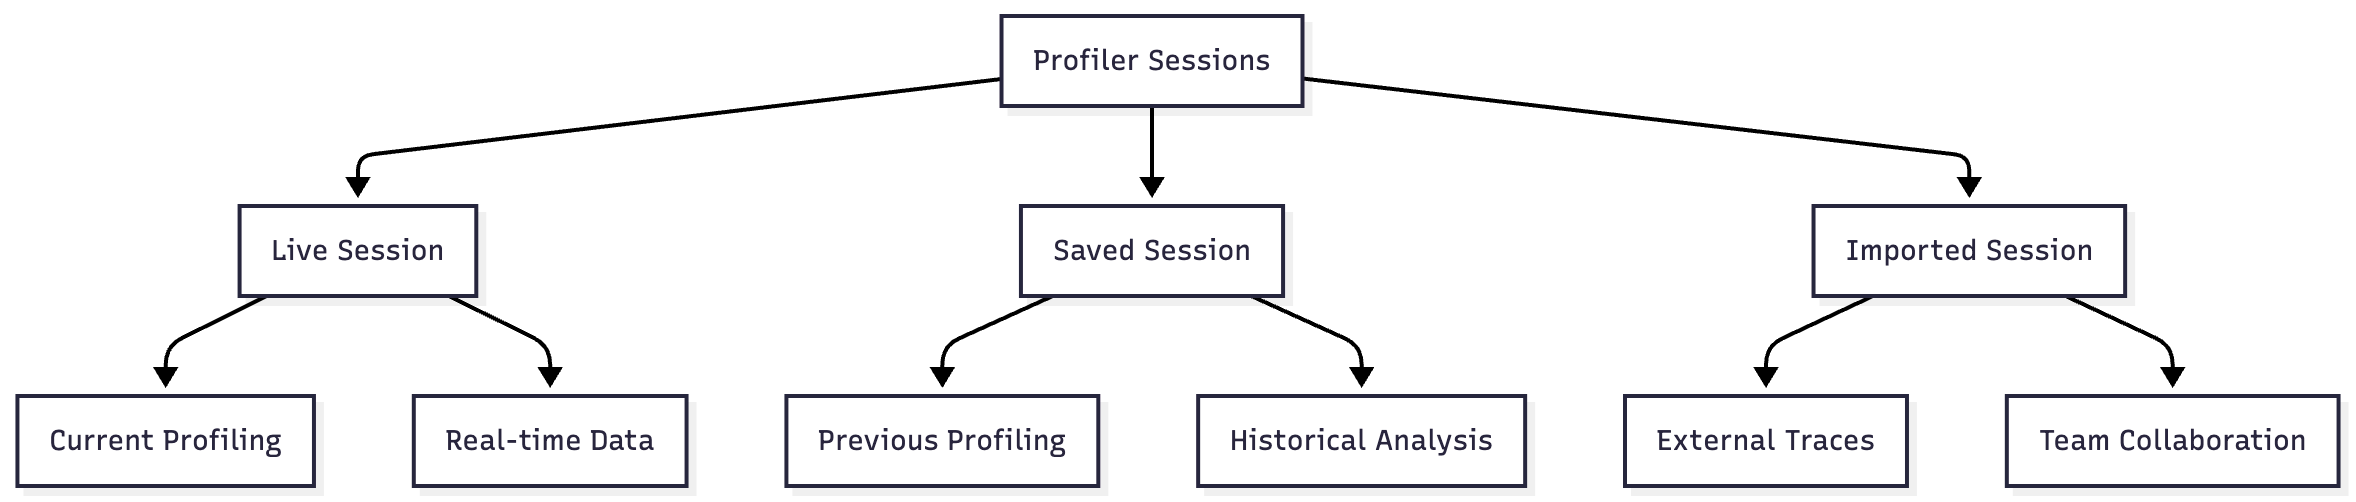
Sessions and Data Management
Session Types:
Trace File Formats:

Workflow for Team Collaboration:
// Developer A: Captures performance issue
// 1. Profile the app during slow operation
// 2. Right-click session → Export
// 3. Saves “slow_scrolling_issue.trace”
// 4. Shares with team via Git LFS or cloud storage

// Developer B: Analyzes the issue
// 1. Drags “slow_scrolling_issue.trace” into Android Studio
// 2. CPU Profiler opens automatically
// 3. Identifies bottleneck in RecyclerView adapter
// 4. Fixes issue and re-profiles to verify
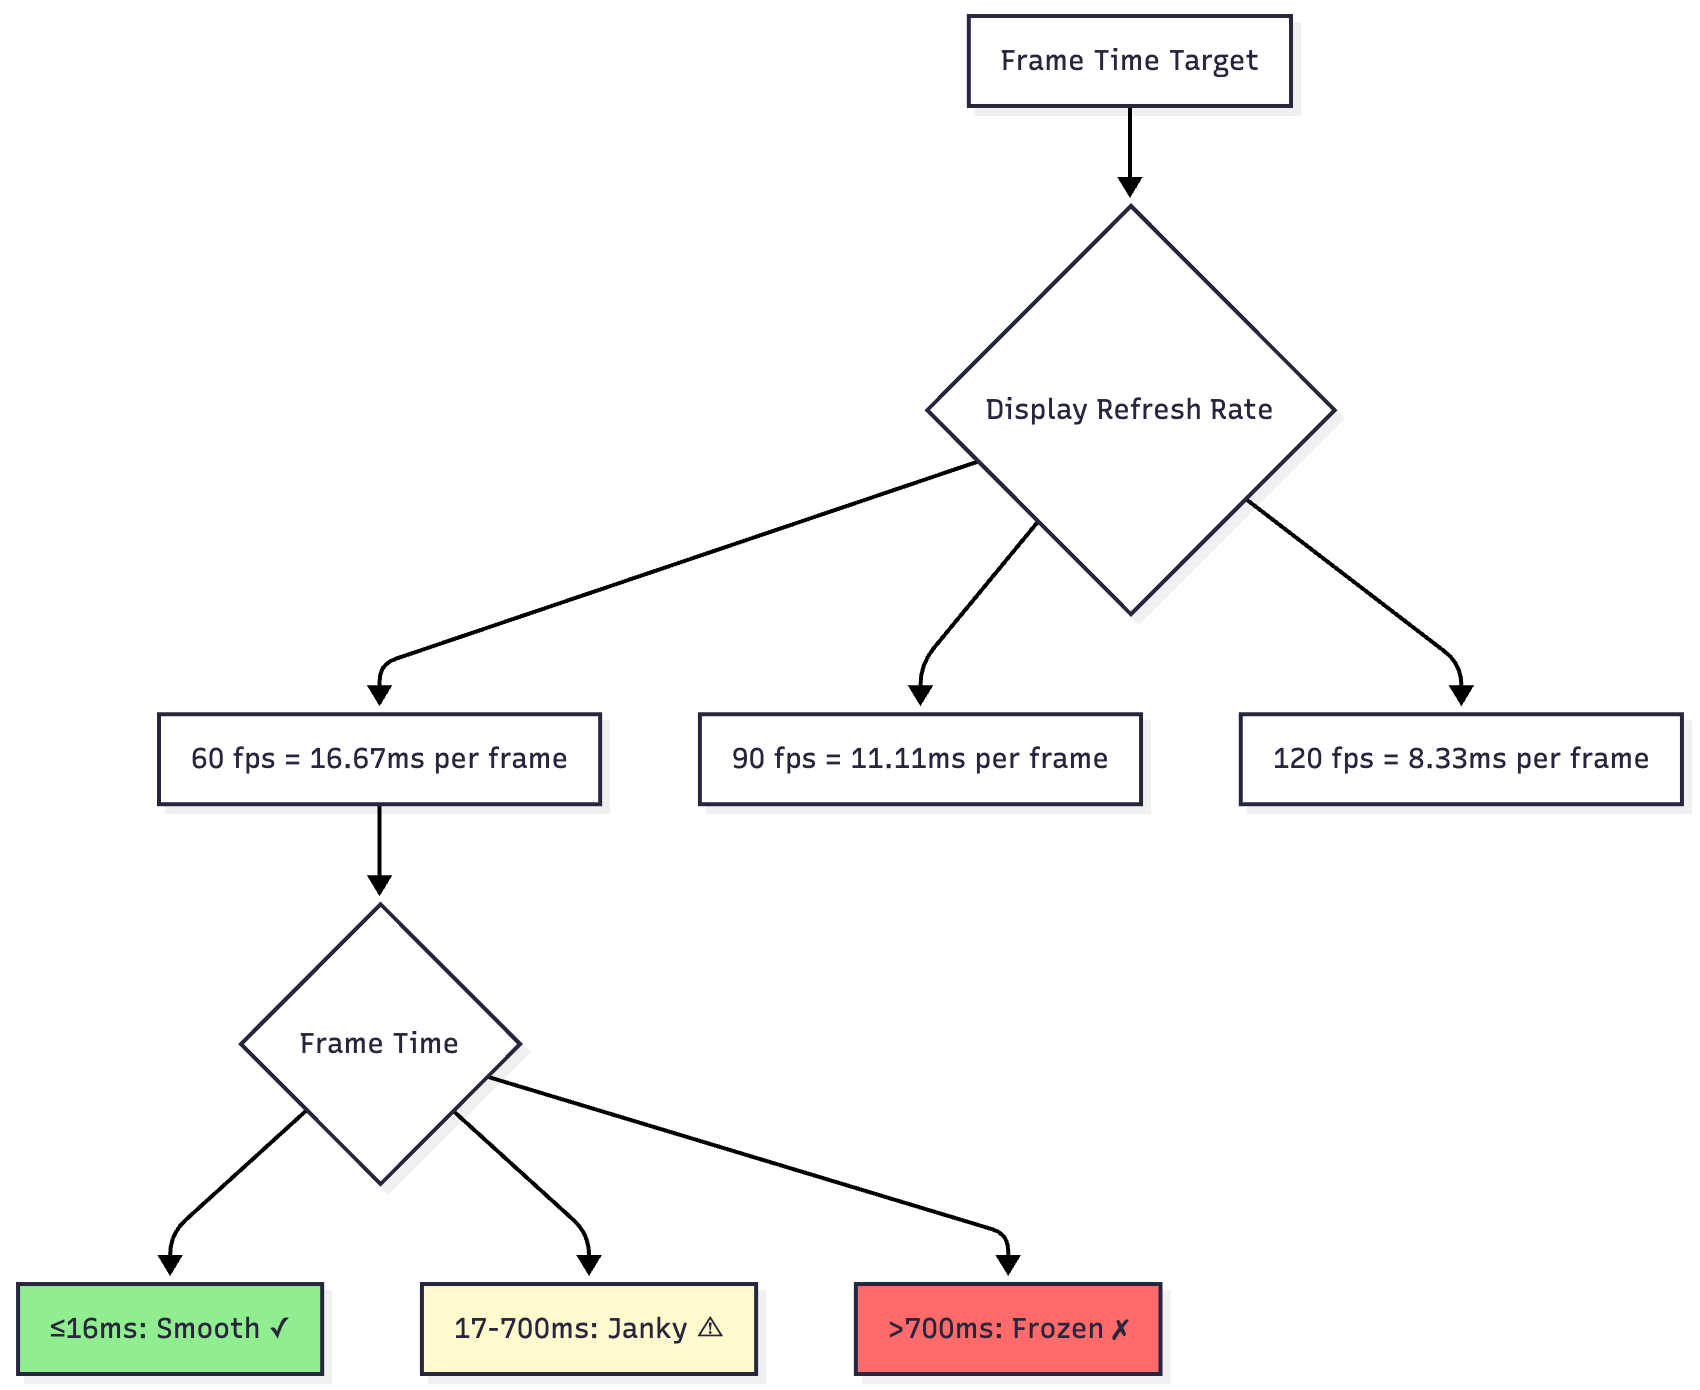
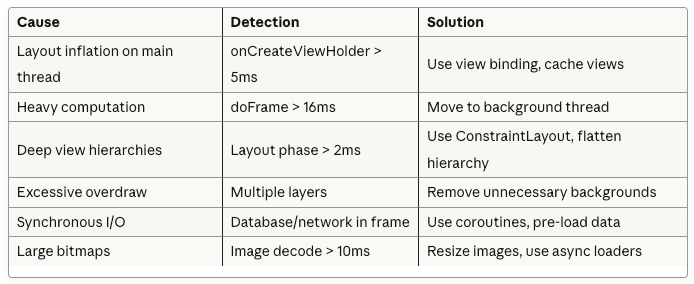
Frame Rendering and Jank Detection
Understanding Jank:
Detecting Jank in Profiler:
class UserListActivity : AppCompatActivity() {
    override fun onCreate(savedInstanceState: Bundle?) {
        super.onCreate(savedInstanceState)
        setContentView(R.layout.activity_user_list)

        val recyclerView = findViewById<RecyclerView>(R.id.recyclerView)
        recyclerView.adapter = object : RecyclerView.Adapter<ViewHolder>() {
            override fun onBindViewHolder(holder: ViewHolder, position: Int) {
                // PROBLEM: Heavy work on main thread!
                val user = loadUserFromDatabase(position)  // 50ms sync DB call
                val avatar = loadAvatarImage(user.avatarUrl)  // 100ms image decode
                holder.bind(user, avatar)
                // Total: 150ms per item = massive jank!
            }

            override fun onCreateViewHolder(parent: ViewGroup, viewType: Int): ViewHolder {
                // PROBLEM: Layout inflation on main thread
                return ViewHolder(
                    LayoutInflater.from(parent.context)
                        .inflate(R.layout.complex_item, parent, false)  // 25ms
                )
            }

            override fun getItemCount() = 1000
        }
    }
}
Profiler Output:
Display Section:
├─ Frame 1: 16ms ✓
├─ Frame 2: 165ms ✗ (JANK - red bar)
│  ├─ doFrame: 155ms
│  │  ├─ onBindViewHolder: 150ms ⚠
│  │  │  ├─ loadUserFromDatabase: 50ms
│  │  │  └─ loadAvatarImage: 100ms
│  │  └─ measure/layout: 5ms
│  └─ DrawFrame: 10ms
├─ Frame 3: 172ms ✗ (JANK - red bar)
└─ User experience: Visible stuttering during scroll
Optimized Version:
class UserListActivity : AppCompatActivity() {
    private val userCache = LruCache<Int, User>(100)
    private val imageLoader = ImageLoader(this)

    override fun onCreate(savedInstanceState: Bundle?) {
        super.onCreate(savedInstanceState)
        setContentView(R.layout.activity_user_list)

        val recyclerView = findViewById<RecyclerView>(R.id.recyclerView)

        // Pre-load data asynchronously
        lifecycleScope.launch {
            preloadUsers()
        }

        recyclerView.apply {
            setHasFixedSize(true)  // Performance optimization
            setItemViewCacheSize(20)  // Increase cache
            recycledViewPool.setMaxRecycledViews(0, 30)

            adapter = object : RecyclerView.Adapter<ViewHolder>() {
                override fun onBindViewHolder(holder: ViewHolder, position: Int) {
                    // Fast: Load from cache
                    val user = userCache.get(position)

                    // Async image loading
                    imageLoader.load(user.avatarUrl)
                        .placeholder(R.drawable.placeholder)
                        .into(holder.avatarView)

                    holder.bind(user)
                    // Total: <2ms = smooth!
                }

                override fun onCreateViewHolder(parent: ViewGroup, viewType: Int): ViewHolder {
                    // Use view binding for faster inflation
                    val binding = ItemUserBinding.inflate(
                        LayoutInflater.from(parent.context),
                        parent,
                        false
                    )
                    return ViewHolder(binding)
                }

                override fun getItemCount() = userCache.size()
            }
        }
    }

    private suspend fun preloadUsers() = withContext(Dispatchers.IO) {
        // Load in background
        val users = database.userDao().getAllUsers()
        users.forEachIndexed { index, user ->
            userCache.put(index, user)
        }
    }
}
New Profiler Output:
Display Section:
├─ Frame 1: 14ms ✓
├─ Frame 2: 11ms ✓
├─ Frame 3: 13ms ✓
├─ Frame 4: 12ms ✓
└─ User experience: Buttery smooth 60fps scrolling!
Common Jank Causes and Solutions:
Best Practices and Workflow
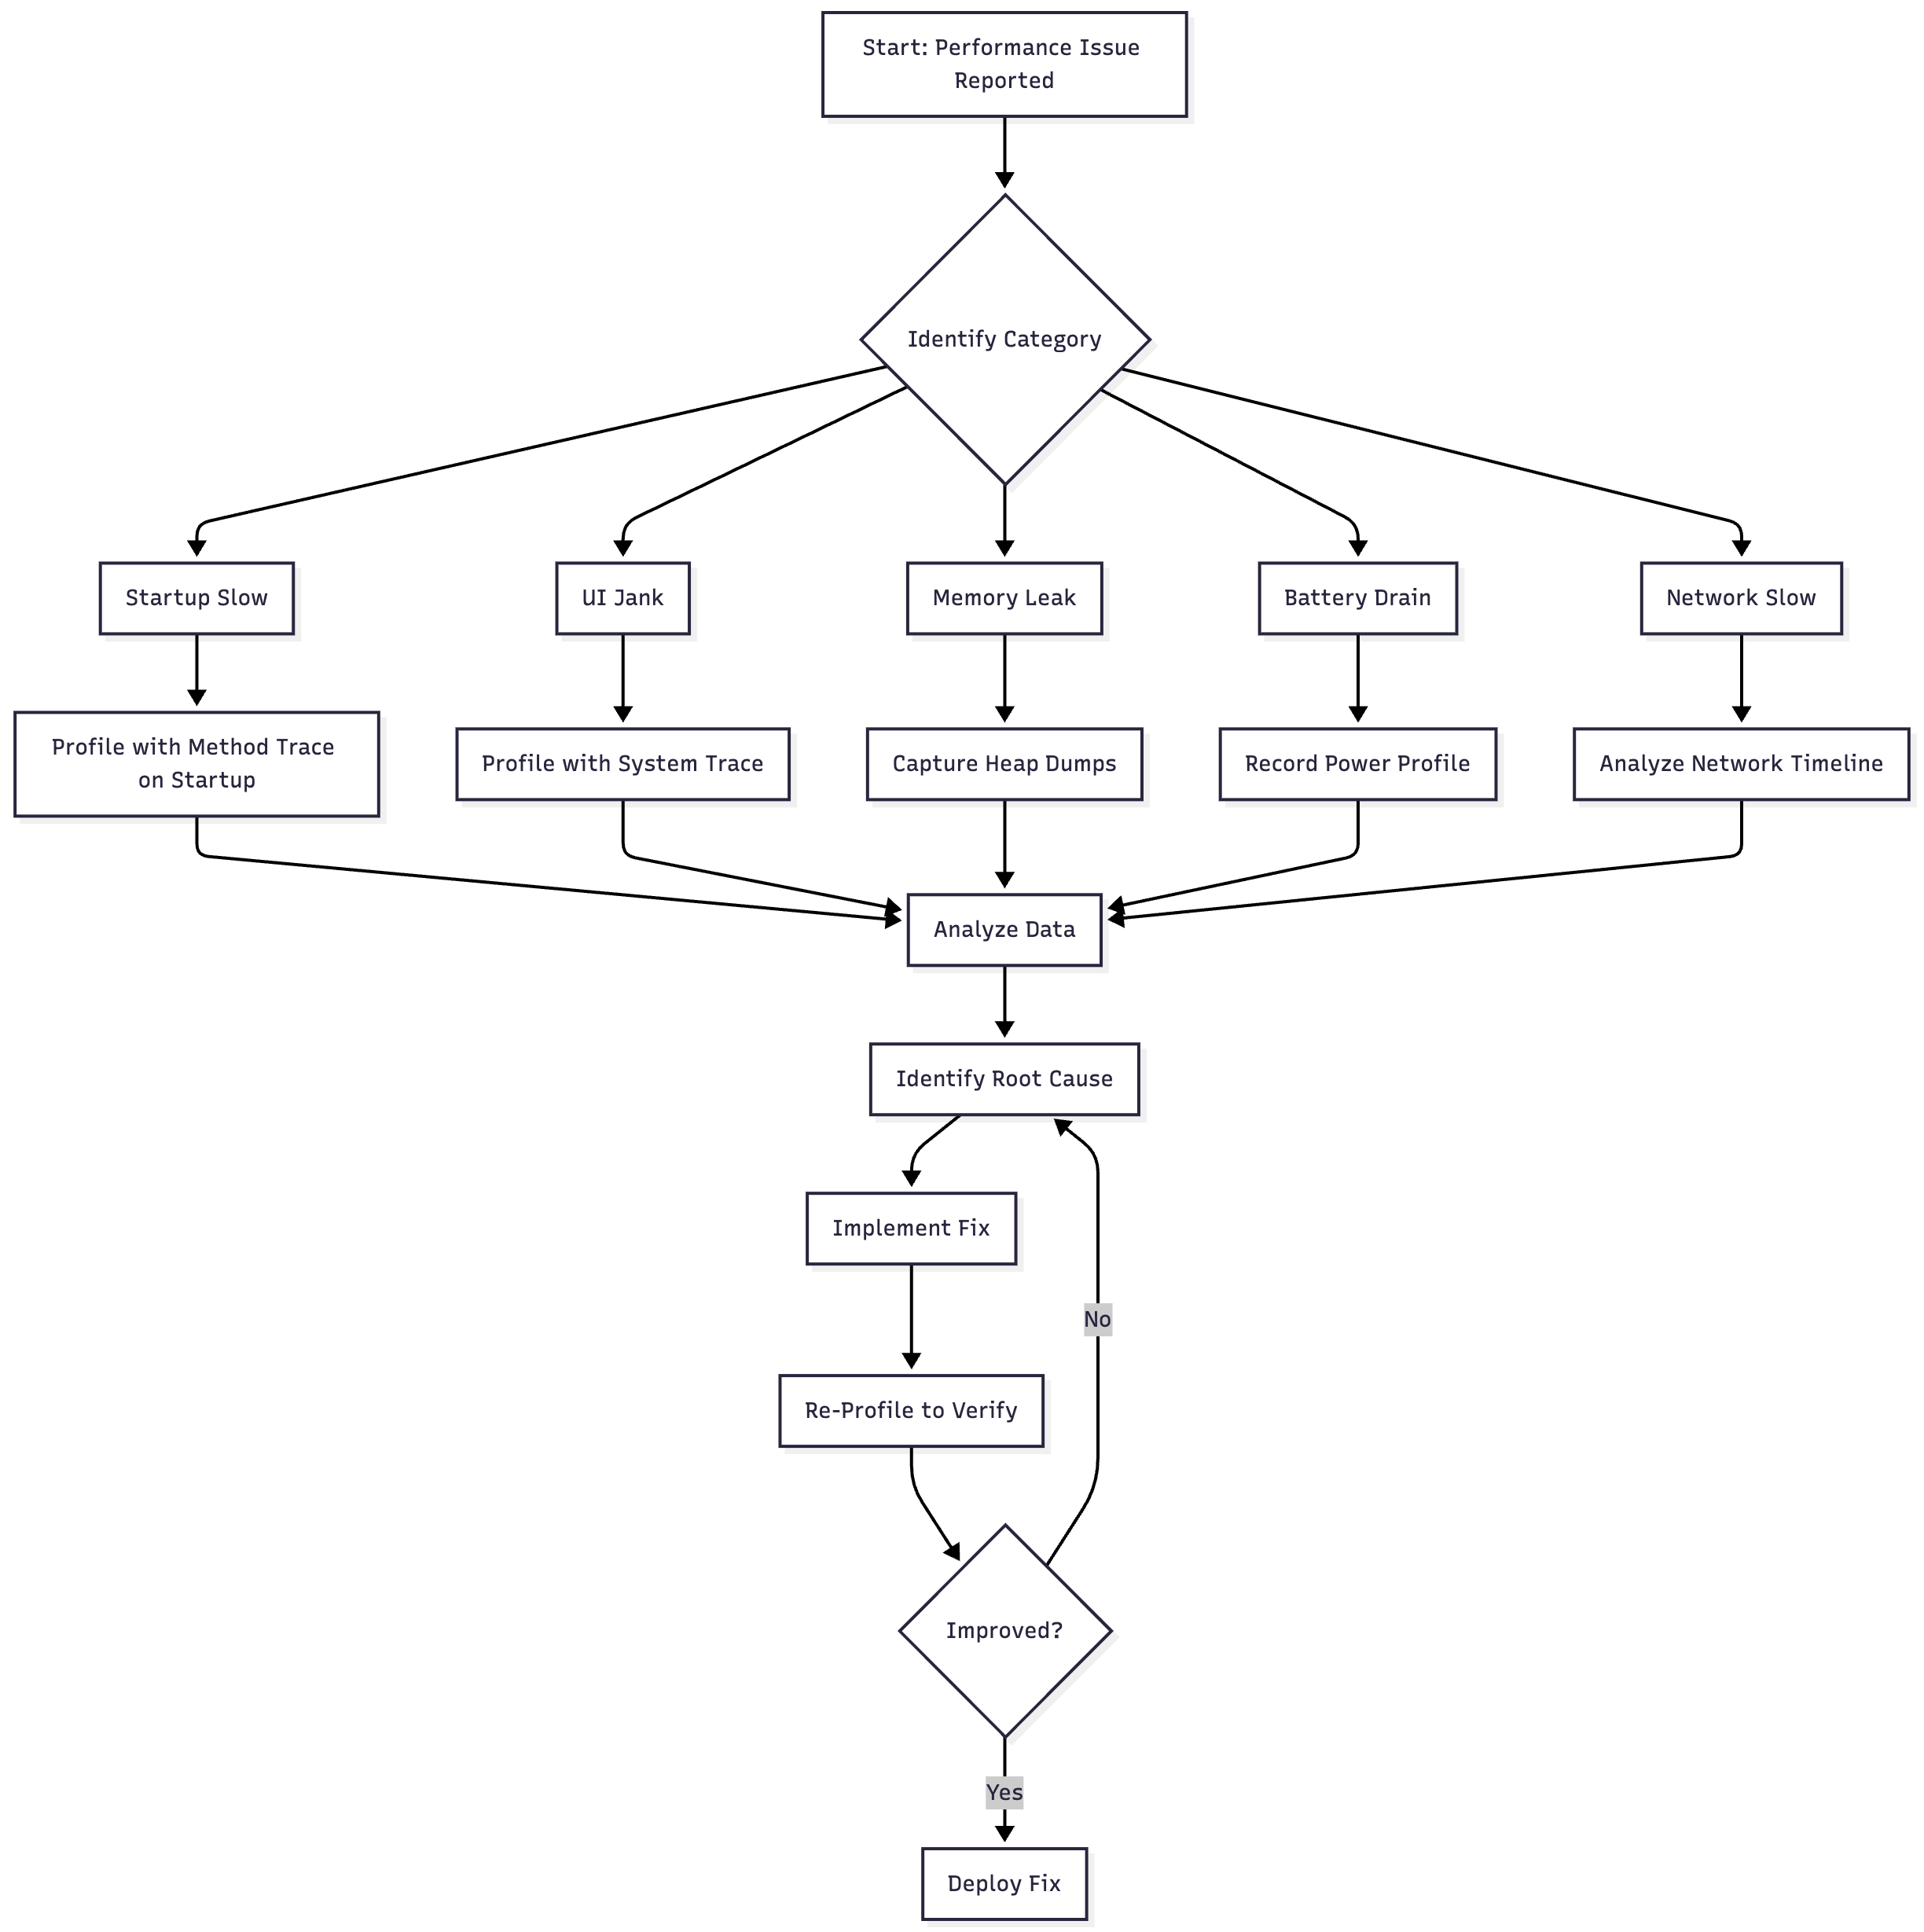
Profiling Workflow
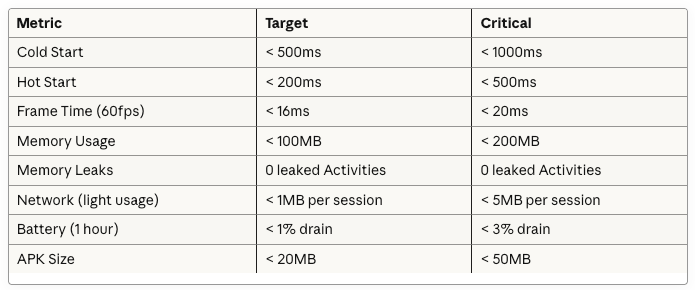
Performance Budgets
Set quantitative targets for your app:
Profiling Tips by Category
CPU Profiling:
// ✓ DO: Use system traces for rendering issues
fun profileRendering() {
    // System trace shows full rendering pipeline:
    // - UI thread doFrame
    // - RenderThread DrawFrame
    // - GPU composition
    // - SurfaceFlinger
}

// ✓ DO: Use sampled methods for general performance
fun profileGeneralPerformance() {
    // Sampled recording with low overhead
    // Shows relative CPU usage of methods
}

// ✗ DON’T: Use instrumented trace for long sessions
fun badProfilingPractice() {
    // Instrumented recording for 30 seconds
    // = 10-20% overhead, inaccurate results!
}

// ✓ DO: Keep instrumented traces short
fun goodProfilingPractice() {
    // Instrumented recording for 2-3 seconds
    // = Precise timing of specific operation
}
Memory Profiling:
// ✓ DO: Force GC before heap dump
fun captureAccurateHeapDump() {
    // Click GC button 2-3 times
    // Wait for memory to stabilize
    // Then capture heap dump
    // = Clearer picture of actual leaks
}

// ✓ DO: Use sampled allocation for most cases
fun trackAllocations() {
    // Sampled mode: 2048 byte intervals
    // ~2% overhead, suitable for long sessions
}

// ✓ DO: Use full allocation only for specific leak investigation
fun investigateSpecificLeak() {
    // Full mode: every allocation
    // High overhead, but complete call stacks
    // Keep recording under 30 seconds
}

// ✗ DON’T: Ignore Activity/Fragment leaks
class LeakyActivity : AppCompatActivity() {
    companion object {
        var instance: LeakyActivity? = null  // This will be flagged!
    }
}
Network Profiling:
// ✓ DO: Batch requests when possible
fun efficientNetworking() {
    // Single request for multiple resources
    api.getBatchData(listOf(
        “users”, “posts”, “comments”
    ))
}

// ✗ DON’T: Make sequential individual requests
fun inefficientNetworking() {
    api.getUsers()  // Request 1: 300ms
    api.getPosts()  // Request 2: 250ms
    api.getComments()  // Request 3: 400ms
    // Total: 950ms (could be 400ms with batching!)
}

// ✓ DO: Implement proper caching
fun implementCaching() {
    OkHttpClient.Builder()
        .cache(Cache(cacheDir, 10 * 1024 * 1024))  // 10MB cache
        .build()
}

// ✓ DO: Use compression
fun useCompression() {
    Request.Builder()
        .url(url)
        .header(”Accept-Encoding”, “gzip”)  // Enable compression
        .build()
}
Energy Profiling:
// ✓ DO: Release resources immediately
class CameraActivity : AppCompatActivity() {
    private var camera: Camera? = null

    override fun onPause() {
        super.onPause()
        camera?.release()  // Release immediately!
        camera = null
    }
}

// ✓ DO: Use coarse location when fine location not needed
fun requestLocation() {
    if (needsPreciseLocation) {
        fusedLocationClient.requestLocationUpdates(
            LocationRequest.create().apply {
                priority = LocationRequest.PRIORITY_HIGH_ACCURACY
                interval = 10000  // 10 seconds
            },
            locationCallback,
            Looper.getMainLooper()
        )
    } else {
        // Much more power-efficient!
        fusedLocationClient.requestLocationUpdates(
            LocationRequest.create().apply {
                priority = LocationRequest.PRIORITY_BALANCED_POWER_ACCURACY
                interval = 60000  // 1 minute
            },
            locationCallback,
            Looper.getMainLooper()
        )
    }
}

// ✓ DO: Use WorkManager for background tasks
fun scheduleBackgroundWork() {
    val constraints = Constraints.Builder()
        .setRequiredNetworkType(NetworkType.CONNECTED)
        .setRequiresBatteryNotLow(true)  // Wait for good conditions
        .setRequiresCharging(false)
        .build()

    val workRequest = PeriodicWorkRequestBuilder<SyncWorker>(
        15, TimeUnit.MINUTES
    )
        .setConstraints(constraints)
        .build()

    WorkManager.getInstance(context).enqueue(workRequest)
}
Integration with CI/CD
Automated Performance Testing:
// Macrobenchmark test for CI/CD
@RunWith(AndroidJUnit4::class)
class AppStartupBenchmark {
    @get:Rule
    val benchmarkRule = MacrobenchmarkRule()

    @Test
    fun startupCompilation() = benchmarkRule.measureRepeated(
        packageName = “com.example.myapp”,
        metrics = listOf(StartupTimingMetric()),
        iterations = 5,
        startupMode = StartupMode.COLD
    ) {
        pressHome()
        startActivityAndWait()
    }
}
CI Pipeline Integration:
# .github/workflows/performance.yml
name: Performance Tests

on: [pull_request]

jobs:
  benchmark:
    runs-on: macos-latest
    steps:
      - uses: actions/checkout@v3

      - name: Run Benchmarks
        run: ./gradlew :app:connectedAndroidTest

      - name: Parse Results
        run: |
          STARTUP_TIME=$(cat app/build/outputs/benchmark/startup.json | jq ‘.median’)
          echo “Startup time: ${STARTUP_TIME}ms”

          if [ $STARTUP_TIME -gt 500 ]; then
            echo “❌ Startup time regression detected!”
            exit 1
          fi

      - name: Comment on PR
        uses: actions/github-script@v6
        with:
          script: |
            github.rest.issues.createComment({
              issue_number: context.issue.number,
              owner: context.repo.owner,
              repo: context.repo.repo,
              body: ‘⚡ Performance: Startup time is ${STARTUP_TIME}ms (target: <500ms)’
            })
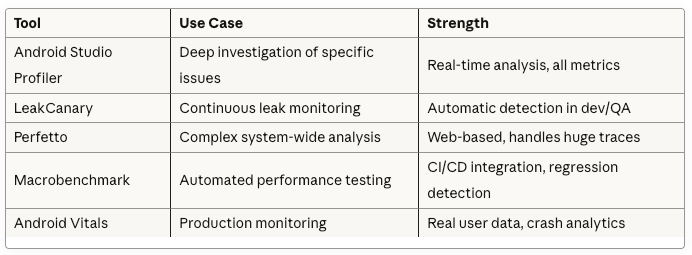
Complementary Tools
Tool Ecosystem:

When to Use Each:
Conclusion
The Android Studio Profiler is an indispensable tool for building high-performance Android applications. By mastering its various components—CPU, Memory, Network, and Power profilers—you can systematically identify and eliminate performance bottlenecks.
Key Takeaways
Choose the right build type: Use profileable builds for accurate measurements, debuggable only when you need specific features
Profile systematically: Start with high-level view, drill down into specific areas
Set performance budgets: Define quantitative targets and enforce them
Automate testing: Integrate benchmarks into CI/CD pipeline
Use complementary tools: Android Studio Profiler + LeakCanary + Macrobenchmark = comprehensive performance strategy
Performance Optimization Checklist
✓ Cold start under 500ms
✓ Smooth 60fps scrolling (frames < 16ms)
✓ No memory leaks (0 leaked Activities/Fragments)
✓ Network requests batched and cached
✓ Proper wake lock management
✓ Background work scheduled efficiently
✓ Baseline profiles generated
✓ Layout hierarchy optimized (depth < 10)
✓ Images properly sized and cached
✓ Database queries indexed and optimized
Remember: Performance is a feature. Users notice and appreciate fast, responsive apps. Make profiling a regular part of your development workflow, not just something you do when problems arise.
Happy profiling! 🚀